Translating or not?
Excerpt: This resource is designed to make students think about sketching graphs of unfamiliar functions, in particular reciprocals of familiar functions. They are asked to explain the behaviour of for different values of .
Problem
Sketch the graph of for different values of . We suggest you start by trying the values , , .
What do you notice?
Can you explain your observations?
Now sketch the graph of for different values of , again starting with , , .
What do you notice this time?
Can you explain why the graphs behave in this way?
Suggestion
Graph sketching
When sketching the graph of an unfamiliar function, it might help to think about the following.
- Where does the graph cross the axes?
- When is the function positive and when is it negative?
- Does it have any asymptotes?
- Is it increasing or decreasing?
- What happens as gets very large?
- Is it related to any other graphs whose shape I know?
As a check, you could substitute in some values of such as , , , .
If you want a final check of your sketches, you could use a graphical calculator or software such as Desmos. Alternatively, you could use the Interactive graphs section of this resource.
Now sketch the graph of for different values of .
In addition to the above, you might find it helpful to first sketch the graph of (for your chosen value of ). How does the graph of relate to the graph of ?
Things you may have noticed
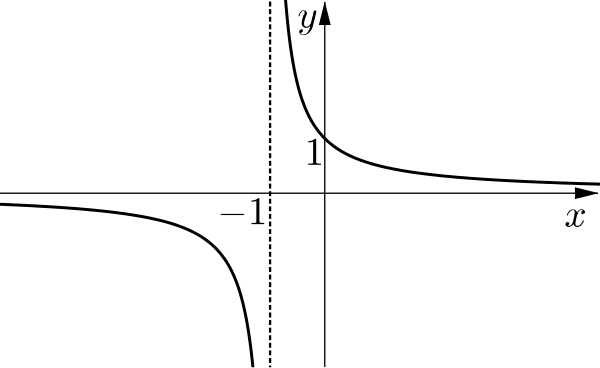
The graph of is familiar. The family of graphs of all look very similar.
Can you describe how they are related and the significance of the value ?
The shape of these graphs is very different for different values of . We can split our graphs into the cases , and .
When
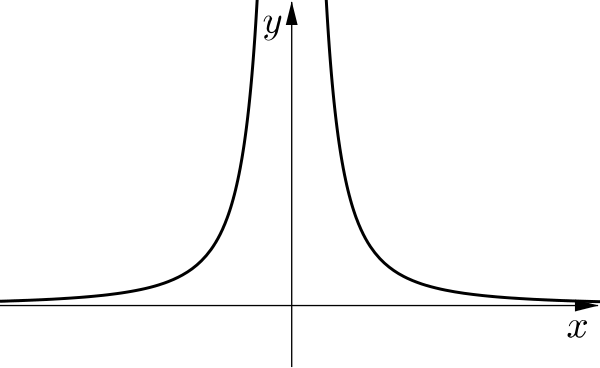
This is the familiar graph .
We can visualise it as the reciprocal of .
- When , so has a vertical asymptote.
- As increases, increases so decreases towards zero.
- The function is even since the value is squared, so the -axis is a line of symmetry.
When
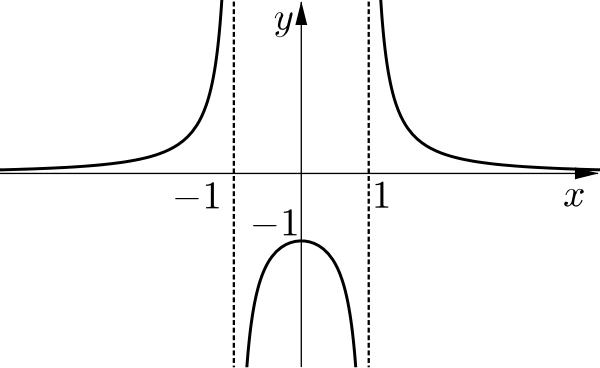
We might have expected to be a translation of , but instead it does something much more interesting!
To understand this behaviour, we could think about the graph of and what the reciprocal will look like, paying particular attention to where it crosses the -axis. How, then, does the shape of change as takes negative values other than ?
Another way to visualise this is to rewrite the function in terms of other functions whose graphs we are familiar with. Since is negative, we could rewrite our function as (where ). Can you now rewrite this further?
We can factorise the denominator, and then expand this as partial fractions. The function can now be seen as the sum of two translated and scaled functions. How can this help to understand the behaviour of our function as varies?
Solution
When
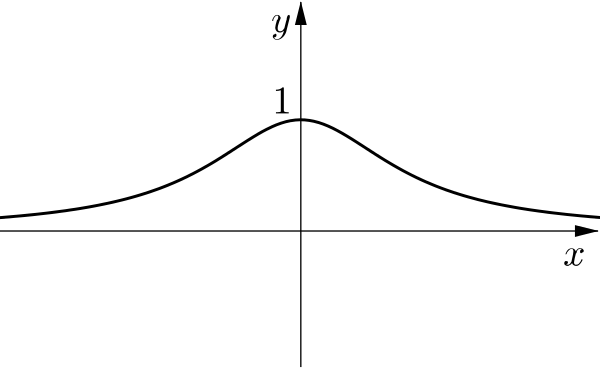
Now, we find that there are no vertical asymptotes. Can you explain why by thinking about the graph of the quadratic ?
What if we rewrite this function as ? Can you expand this as we did above?
In this case, when , what happens to the graph as takes different positive values?
Joining them up
As gets close to zero, can you visualise how each of these more interesting graphs will become closer and closer to the graph of ?
Use graphing software or the applets in the next section to view this transition.
Interactive graphs
Here is the graph of ; you can use the slider to change the value of .
[interactive embed (geogebra-iframe): //www.geogebratube.org/material/iframe/id/dfhxYDYQ/width/592/height/420/border/888888/rc/false/ai/false/sdz/false/smb/false/stb/false/stbh/false/ld/false/sri/true/asb/false/at/html5] — not part of the text import; see the source page.
Download GeoGebra file
Here is the graph of ; you can again use the slider to change the value of .
[interactive embed (geogebra-iframe): //www.geogebratube.org/material/iframe/id/j6rdeJuX/width/592/height/420/border/888888/rc/false/ai/false/sdz/false/smb/false/stb/false/stbh/false/ld/false/sri/true/asb/false/at/html5] — not part of the text import; see the source page.
Download GeoGebra file