Inspecting identities
Excerpt: In this resource, students are asked to use the half-angle formulae to help them sketch graphs of and .
Problem
Take a look at these identities.
How could you use these identities to help you sketch graphs of and ?
The resource Proving half-angle formulae looks at a way to prove these identities geometrically.
Things you might have noticed
These ideas may help you to sketch the graphs of and
-
As the left-hand side is a square in each case, we know the right hand sides must be zero or positive. This is fine, because , so will be at least and at most . Similarly, must be between and .
-
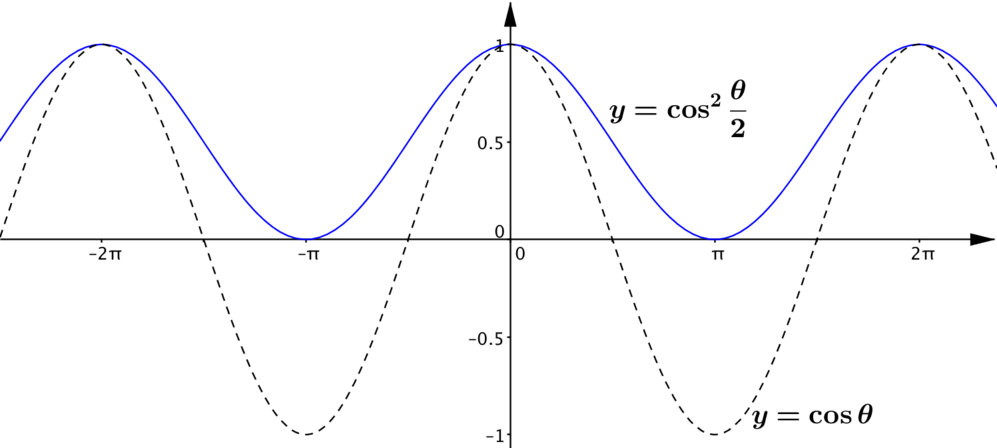
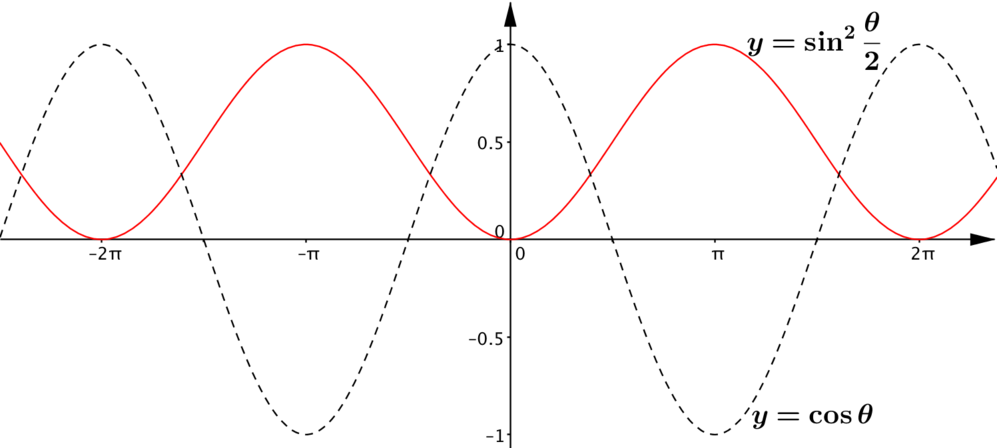
The right-hand sides of the identities are the same except for a minus sign, so we’d expect the behaviour of the two functions to be very similar, but the maximum and minimum values will occur at different values of . For example, will be when (i.e. at even multiples of ) whereas will be when (i.e. at odd multiples of ).
-
The right-hand side of each identity only involves and constants, so the graphs of and can be thought of as transformations of a graph. Which transformations are involved in each case? What is the frequency of and ?
-
Again, from the right-hand side, the identities tell us that is the mean of and and is the mean of and . What does this tell you about the graph of in relation to the graphs of and ?
Graphs
Here are the graphs of and .
Here are the graphs of and .