Demand Curves (Cambridge International A-Level Economics)
An introduction to demand
-
Demand is the amount of a good or service that a consumer is willing and able to purchase at a given price in a given time period
- Effective demand is demand supported by the necessary purchasing power (the ability to pay)
- If a consumer is willing to purchase a good, but cannot afford to, it is not effective demand
-
A demand curve is a graphical representation of the price and quantity demanded (QD) by consumers
- If the data were plotted, it would be an actual curve. Economists, however, use straight lines so as to make analysis easier
-
The law of demand states that there is an inverse relationship between price and quantity demanded (QD), ceteris paribus
- When the price rises, the QD falls
- When the price falls, the QD rises
Individual and market demand
-
Market demand is the combination of all the individual demand for a good or service
- It is calculated by adding up the individual demand at each price level
The Monthly Market Demand for Newspapers in a Small Village
| Customer 1 | Customer 2 | Market Demand |
|---|---|---|
| 8 | 12 | 20 |
- Individual and market demand can also be represented graphically
Market demand for children's swimwear
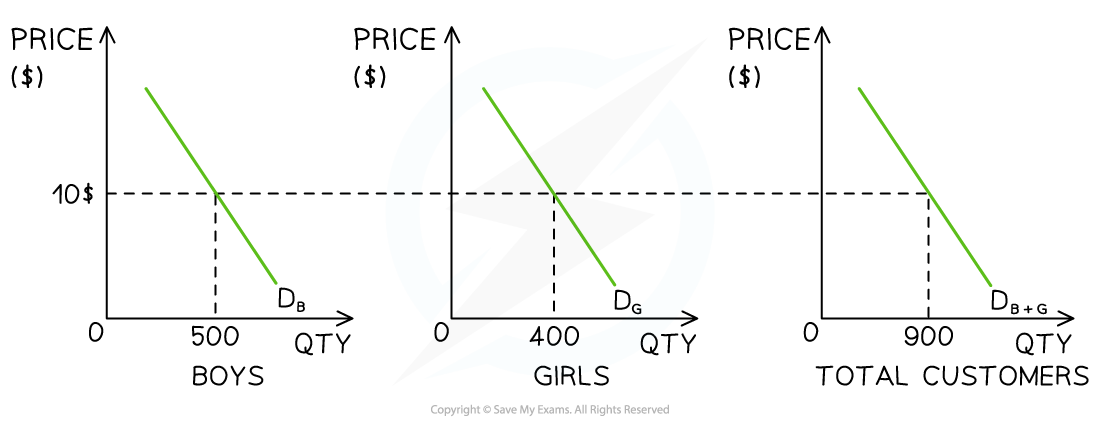
*Boys, girls and total customer demand curves for children's swimwear in July *
Diagram analysis
- A shop sells both boys' and girls' swimwear.
- In July, at a price of $10, the demand for boys' swimwear is 500 units and girls' is 400 units
- At a price of $10, the shop's market demand during July is 900 units
Movements along the demand curve
-
If price is the only factor that changes (ceteris paribus), there will be a change in the quantity demanded (QD)
- This change is shown by a movement along the demand curve
Movement along the demand curve
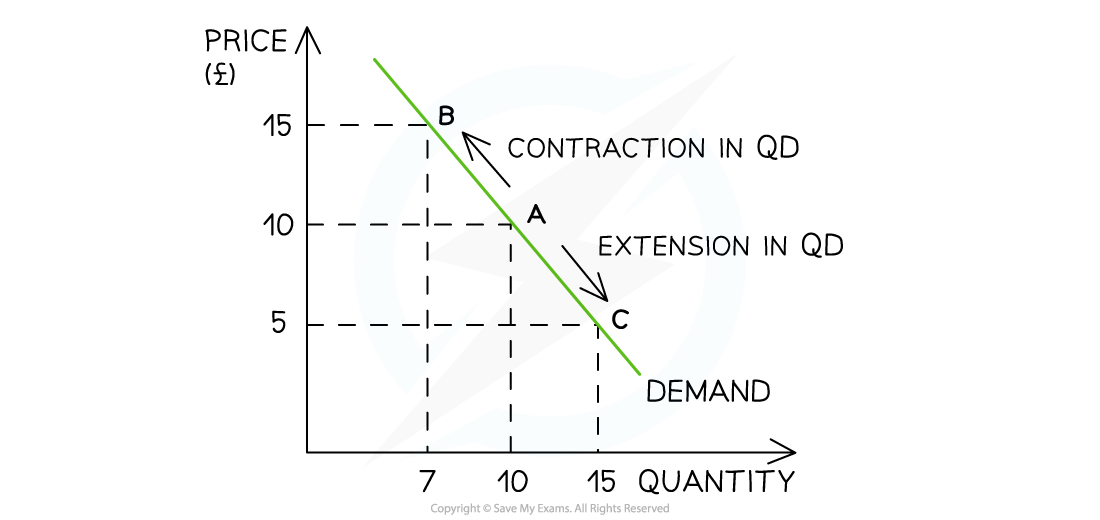
A demand curve shows a contraction in quantity demanded (QD) as prices increase and an extension in quantity demanded (QD) as prices decrease
Diagram analysis
-
An increase in price from £10 to £15 leads to a movement up the demand curve from point A to B
- Due to the increase in price, the QD has fallen from 10 to 7 units
- This movement is called a contraction in QD
-
A decrease in price from £10 to £5 leads to a movement down the demand curve from point A to point C
- Due to the decrease in price, the QD has increased from 10 to 15 units
- This movement is called an extension in QD
The determinants of demand
Spec point —
2.1.3
-
There are numerous factors that will change the demand for a good or service, irrespective of the price level
-
Collectively, these factors are called the determinants of demand and include
- Changes in real income
- Changes in tastes/preferences/fashion/trends
- Advertising and branding
- Changes in the price of related goods (substitutes and complements)
- Changes in the population size and structure
- Future price expectations
Shifts of the entire demand curve
- Changes to each of the determinants of demand shift the entire demand curve (as opposed to a movement along the demand curve)
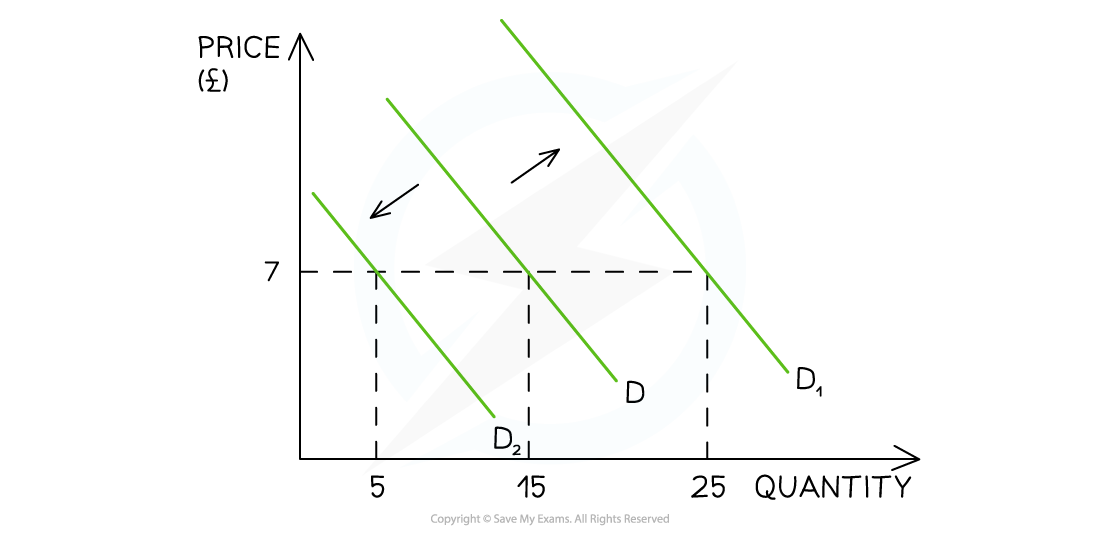
A graph that shows how changes to any of the conditions of demand shifts the entire demand curve left or right, irrespective of the price level
-
For example, if a firm increases their Instagram advertising, there will be an increase in demand as more consumers become aware of the product
- This is a shift in demand from D to D1. The price remains unchanged at £7 but the demand has increased from 15 to 25 units
Illustrating changes to the determinants of demand
Spec point —
2.1.3
1. A change in real income
- Real Income determines how many goods/services can be enjoyed by consumers
- In most cases, there is a direct relationship between income and demand for goods and services
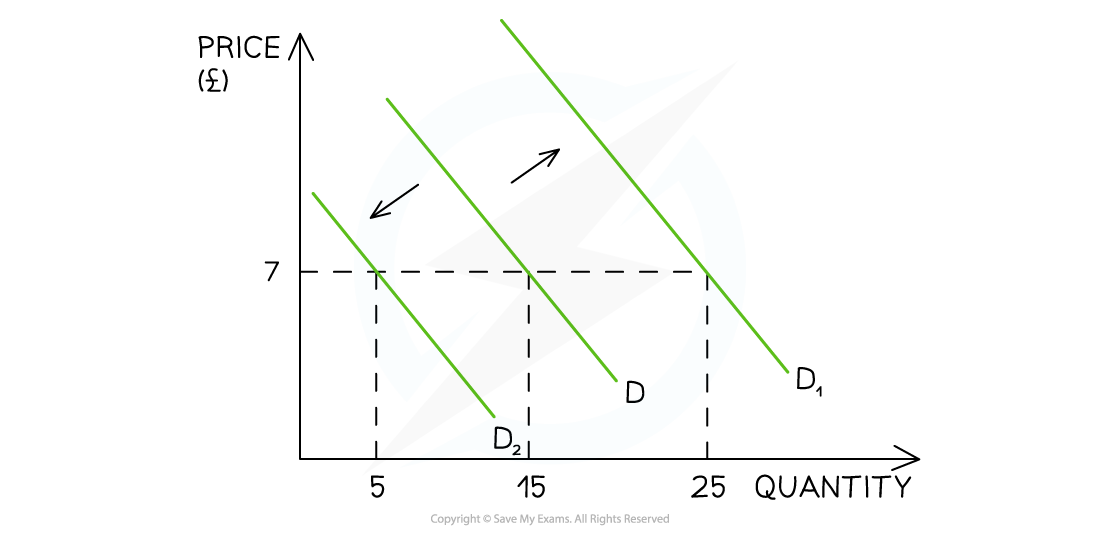
A graph that shows how changes to any of the conditions of demand shifts the entire demand curve left or right, irrespective of the price level
-
If income increases
- Demand increases and shifts right (D→D1)
-
If income decreases
- Demand decreases and shifts left (D→D2)
2. Change in consumer tastes and preferences
- If goods and services become more fashionable, then demand for them increases
- There is a direct relationship between changes in consumer preferences and demand
A graph that shows how changes to any of the conditions of demand shifts the entire demand curve left or right, irrespective of the price level
-
If preference for a product increase
- Demand increases and shifts right (D→D1)
-
If preference for a product decrease
- Demand decreases and shifts left (D→D2)
3. Improved advertising and branding
- If more money is spent on advertising or branding, then demand for goods and services will increase as more consumers become aware of the product
- There is a direct relationship between branding or advertising and demand
A graph that shows how changes to any of the conditions of demand shifts the entire demand curve left or right, irrespective of the price level
-
If advertising or brand awareness of a product increases
- Demand increases and shifts right (D→D1)
-
If advertising or brand awareness of a product decreases
- Demand decreases and shifts left (D→D2)
4. Changes in the prices of substitute goods
-
Changes in the price of substitute goods will influence the demand for a product/service
-
There is a direct relationship between the price of good A and demand for good B
- For example, the price of a Sony 60" TV increases so the demand for LG 60" TV increases
A graph that shows how changes to any of the conditions of demand shifts the entire demand curve left or right, irrespective of the price level
-
If the price of good A increases
- Demand for good B increases and shifts right (D→D1)
-
If the price of good A decreases
- Demand for good B decreases and shifts left (D→D2)
5. Changes in the prices of complementary goods
-
Changes in the price of complementary goods will influence the demand for a product or service
-
There is an inverse relationship between the price of good A and demand for good B
- For example, the price of printer ink increases so the demand for ink printers decreases
A graph that shows how changes to any of the conditions of demand shifts the entire demand curve left or right, irrespective of the price level
-
If the price of good A increases
- Demand for good B decreases and shifts left (D→D2)
-
If the price of good A decreases
- Demand for good B increases and shifts right (D→D1)
6. Changes in population size or distribution
-
If the population size of a country changes over time, then demand for goods and services will also change
-
There is a direct relationship between the changes in population size and demand
-
Demand will also change if there is a change to the age distribution in a country, as different ages demand different goods and services
- For example, an ageing population will buy more hearing aids
A graph that shows how changes to any of the conditions of demand shifts the entire demand curve left or right, irrespective of the price level
-
If the population increases
- Demand increases and shifts right (D→D1)
-
If the population decreases
- Demand decreases and shifts left (D→D2)
Exam Hint The difference between a movement along the demand curve and a shift in demand is essential to understand
When price changes (ceteris paribus), there is a movement along the demand curve resulting in a change to quantity demanded, which is a **contraction **or extension
When a condition of demand changes, there is a shift of the entire demand curve, resulting in a change to demand,** which is an increase** or a decrease in demand
Was this revision note helpful?
Build on this topic