Supply Curves (Cambridge International A-Level Economics)
An Introduction to supply
-
Supply is the amount of a good or service that a producer is willing and able to supply at a given price in a given time period
-
A supply curve is a graphical representation of the price and quantity supplied by producers
- If the data were plotted, it would be an actual curve. Economists, however, use straight lines so as to make analysis easier
-
The supply curve is upward sloping, as there is a positive relationship between the price and quantity supplied (QS)
- Rational profit maximising producers would want to supply more as prices increase in order to maximise their profits
-
The law of supply states that there is a positive (direct) relationship between quantity supplied and price, ceteris paribus
- When the price rises, the QS rises
- When the price falls, the QS falls
Individual and market supply
-
Market supply is the combination of all the individual supply for a good or service
- It is calculated by adding up the individual supply at each price level
The Monthly Market Supply of Bread from 4 Bakeries in a Small town
| Bakery 1 | Bakery 2 | Market Supply |
|---|---|---|
| 500 | 400 | 900 |
Individual and market supply curves
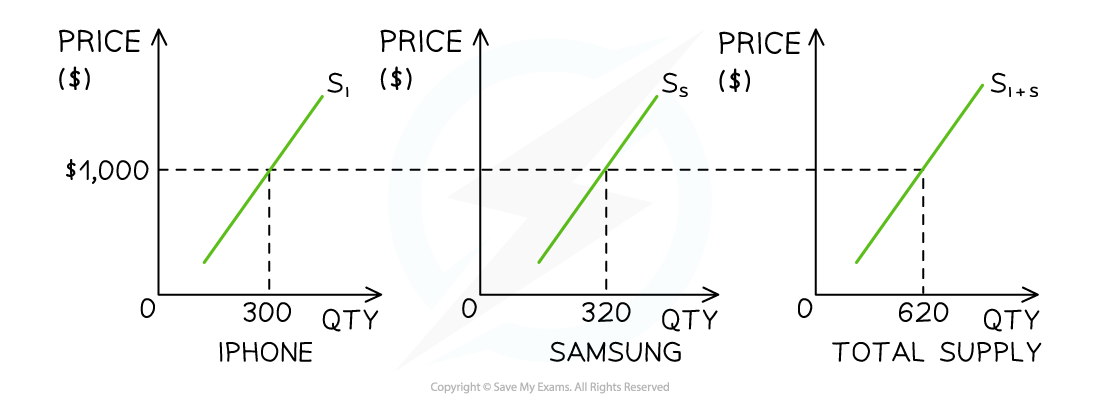
Market supply for smart phones in December is predominantly a combination of iPhone and Samsung supply
Diagram analysis
- In New York City, the market supply for smartphones in December is predominantly a combination of iPhone and Samsung supply
- At a price of $1000, the supply of iPhones is 300 units and the supply of Samsung phones is 320 units
- At a price of $1,000, the market supply of smartphones in New York City during December is 620 units
Movements along the supply curve
-
If price is the only factor that changes (ceteris paribus), there will be a change in the quantity supplied (QS)
- This change is shown by a movement along the supply curve
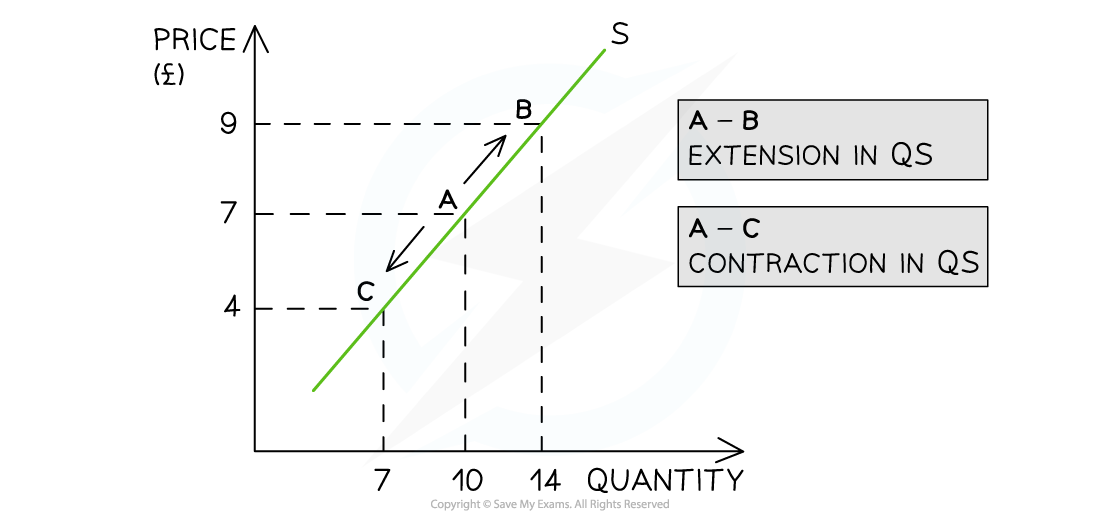
There is an extension in quantity supplied (QS) as prices increase and a contraction in quantity supplied (QS) as prices decrease
Diagram analysis
-
An increase in price from £7 to £9 leads to a movement up the supply curve from point A to B
- Due to the increase in price, the quantity supplied has increased from 10 to 14 units
- This movement is called an extension in QS
-
A decrease in price from £7 to £4 leads to a movement down the supply curve from point A to C
- Due to the decrease in price, the quantity supplied has decreased from 10 to 7 units
- This movement is called a contraction in QS
Determinants of supply
Spec point —
2.1.4
-
There are several factors that will change the supply of a good or service, irrespective of the price level
-
Collectively, these factors are called the determinants of supply and include:
- Changes to the costs of production
- Changes to indirect taxes and subsidies
- Changes to technology
- Changes to the number of firms
- Weather events
- Future price expectations
- Goods in joint and competitive supply
-
Changes to any of the conditions of supply shift the entire supply curve (as opposed to a movement along the supply curve)
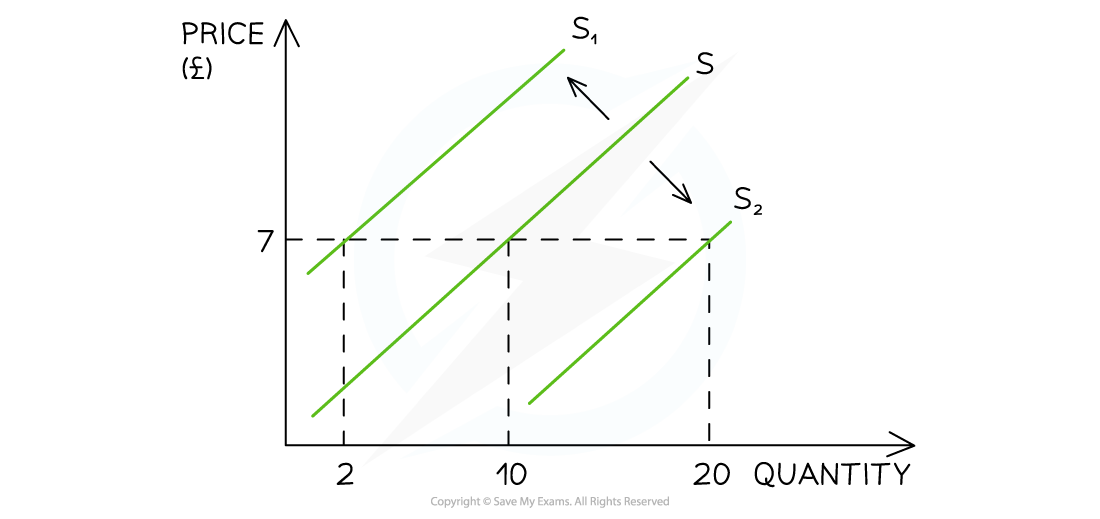
A graph that shows how changes to any of the conditions of supply shift the entire supply curve left or right, irrespective of the price level
Diagram analysis
- If a firm's cost of production increases due to the increase in price of a key resource, then there will be a decrease in supply as the firm can now only afford to produce fewer products
- This is a shift in supply from S to S1. The price remains unchanged at £7 but the supply has decreased from 10 to 2 units
Illustrating changes to the determinants of supply
Spec point —
2.1.4
1. Changes to the costs of production
- If the price of raw materials or other costs of production change, firms respond by changing supply.
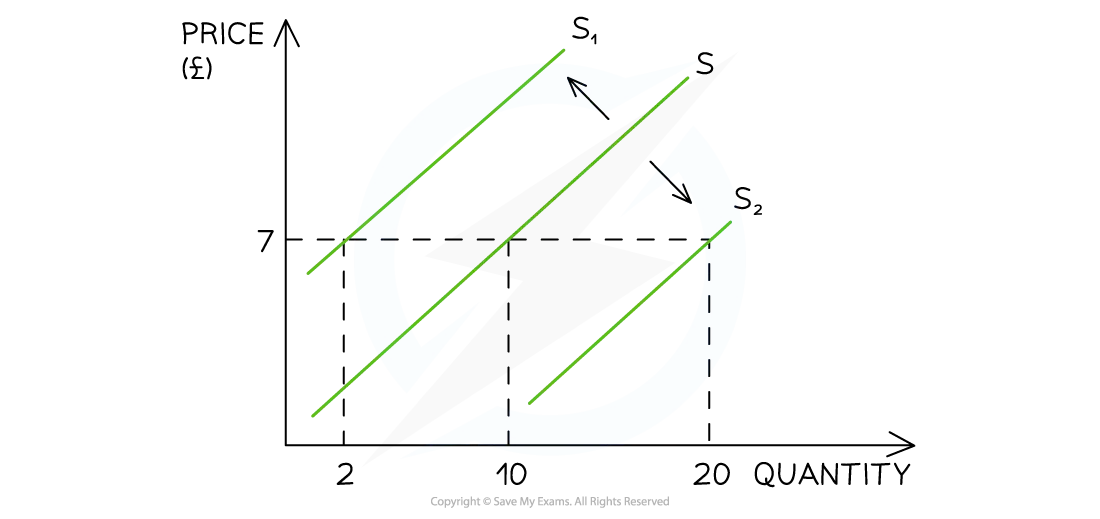
Changes to the conditions of supply shift the entire supply curve
-
If costs of production increase
- Supply decreases and shifts left (S→S1)
- For example, rising aluminium prices increase bicycle production costs in Malaysia, causing supply to fall
-
If costs of production decrease
- Supply increases and shifts right (S→S2)
2. Changes to indirect taxes
- Any change to indirect taxes changes the cost of production for a firm and impacts supply
Changes to the conditions of supply shift the entire supply curve
-
If indirect taxes increase
- Supply decreases and shifts left (S→S1)
- For example, a higher sugar tax in Thailand raises costs for soft drink producers, reducing supply
-
If indirect taxes decrease
- Supply increases and shifts right (S→S2)
3. Changes to subsidies
- Changes to producer subsidies directly impact the cost of production for the firm
Changes to the conditions of supply shift the entire supply curve
-
If subsidies increase
- Supply increases and shifts right (S→S2)
-
If subsidies decrease
- Supply decreases and shifts left (S→S1)
- For example, the removal of farming subsidies in Argentina reduces agricultural output
4. Changes to the state of technology
- New technology increases productivity and lowers costs of production
- Ageing technology can have the opposite effect
Changes to the conditions of supply shift the entire supply curve
-
If technology improves
- Supply increases and shifts right (S→S2)
- For example, new irrigation systems in Morocco help farmers produce more crops with less water
-
If technology worsens
- Supply decreases and shifts left (S→S1)
5. Change in the number of firms in the industry
- The entry and exit of firms into the market has a direct impact on the supply
- If ten new firms start selling building materials in Hanoi, the supply of building material will increase
Changes to the conditions of supply shift the entire supply curve
-
If the number of firms increases
- Supply increases and shifts right (S→S2)
-
If the number of firms decreases
- Supply decreases and shifts left (S→S1)
- For example, several electronics factories close in South Africa due to constant power outages, reducing supply
6. Weather events
- Droughts or flooding can cause a supply shock in agricultural markets
- A drought will cause supply to decrease
- Unexpectedly good growing conditions can cause supply to increase
Changes to the conditions of supply shift the entire supply curve
-
If the weather is good
- Supply increases and shifts right (S→S2)
- For example, ideal monsoon rains boost rice production in India
-
If the weather is bad
- Supply decreases and shifts left (S→S1)
- For example, severe drought in Kenya reduces the coffee harvest, lowering supply
7. Future price expectations
- If firms expect the price of a good or service to increase in the future, they will hold back supply now to sell later at a higher price
- If firms expect the price of a good or service to decrease in the future, they will sell more now before prices fall
Changes to the non-price determinants of supply shift the entire supply curve
-
If prices are expected to rise in the near future
- Supply decreases and shifts left (S→S1)
-
If prices are expected to fall in the near future
- Supply increases and shifts right (S→S2)
Exam Hint Make sure that you explain each condition as its own point before linking it to the cost of production, e.g. a change in indirect taxation
A common error by students is to explain that a subsidy shifts the demand curve for electric vehicles to the right. A subsidy will shift the supply curve to the right. The lower price, will cause a movement along the demand curve (extension of quantity demanded) to create a new market equilibrium
Was this revision note helpful?
Build on this topic