Activation Energy
2 guided lessons · 18 checks · 3. Physical Chemistry → Rates of Reaction
Guided lessons for this note
Which concept don't you understand yet?
We'll explain it simply and check your understanding. Pick any lesson — any order works.
0 of 18 checks correct so far
Lesson 1 of 2
Reading reaction profiles
A reaction profile is the energy level diagram grown a curve: it follows the energy as bonds strain, peak and settle. This lesson names the two features examiners want labelled, the enthalpy arrow and the energy hurdle.
What you know already
From Catalysts you already know that helpers open lower-energy routes through a reaction. This note draws those routes as reaction profiles, adding the peak that particles must clear before any product forms. Reading that peak, and the arrow for the overall change, is the skill this note builds.
Key points of understanding
- Reaction profiles show the relative energies of reactants and products and how energy changes as the reaction progresses.
- The height difference between reactants and products represents the overall enthalpy change.
- For an exothermic reaction the enthalpy value is negative and the arrow points downwards.
- For an endothermic reaction the enthalpy value is positive and the arrow points upwards.
- The climb from reactants up to the peak of the curve marks the energy needed to start reacting.
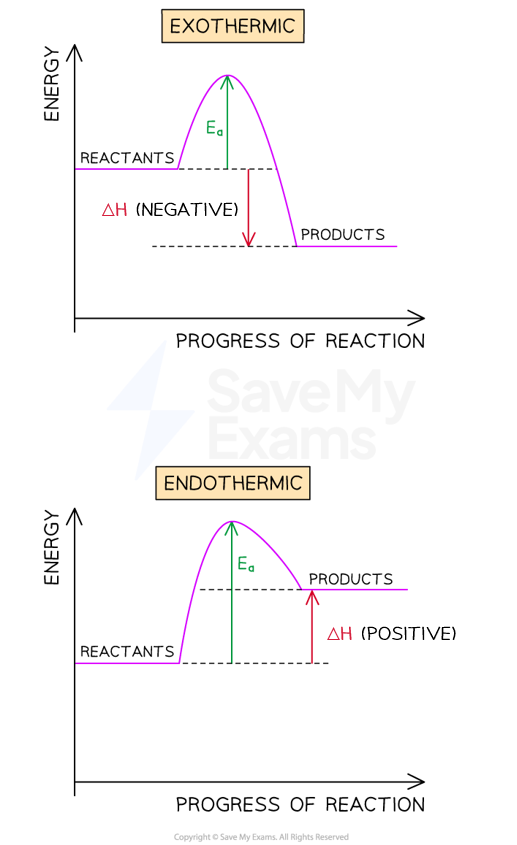
Reaction profiles show enthalpy change and activation energy for the reaction
Choose a confidence level to continue.
Prefer to read it all at once? Show the full lesson as a page
1.Reading reaction profiles
A reaction profile is the energy level diagram grown a curve: it follows the energy as bonds strain, peak and settle. This lesson names the two features examiners want labelled, the enthalpy arrow and the energy hurdle.
Reaction profiles show enthalpy change and activation energy for the reaction
Key points
- Reaction profiles show the relative energies of reactants and products and how energy changes as the reaction progresses.
- The height difference between reactants and products represents the overall enthalpy change.
- For an exothermic reaction the enthalpy value is negative and the arrow points downwards.
- For an endothermic reaction the enthalpy value is positive and the arrow points upwards.
- The climb from reactants up to the peak of the curve marks the energy needed to start reacting.
First pass
The profile line starts at the reactants, climbs over a hump and settles at the products. The hump is the energy hurdle for starting, and the height drop or climb from start to finish gives the overall change.
Analogy — It is like a cross-country run: the race starts and finishes at set heights, but the hardest hill in between decides who can even complete the course.
Exam pointer — Label both the enthalpy change arrow and the activation energy rise when drawing a profile.
Going deeper
A reaction profile traces energy from reactants over a peak to products, with the reactant-to-product gap giving the overall enthalpy change and the reactant-to-peak rise giving the energy hurdle for starting. Downward overall arrows carry negative values for exothermic reactions and upward arrows positive ones for endothermic.
Analogy — A theme-park ride climbs its biggest lift hill before any drops; the lift height is the activation energy and the net height change is the enthalpy change.
Exam pointer — Mark Ea from reactants to peak and ΔH from reactants to products, with the sign matching the direction.
Checks
0 of 9 attempted · 0 correct
2.Catalysts drawn onto the profile
A catalyst redraws the profile with a second, lower hump while the start and finish stay put. This lesson sketches that overlay and explains why the lower hump means a faster reaction.
Key points
- Catalysts provide the reactants with an alternative pathway of lower activation energy.
- A lower peak means a greater proportion of molecules have sufficient energy for an effective collision.
- The catalysed reaction finishes faster than the same reaction without the catalyst.
- The reactant and product levels on the profile are unchanged by adding a catalyst.
- Reactions with low activation energy occur readily because little energy is needed to begin.
First pass
Draw the same start and finish, then add a smaller hump labelled as the catalysed route. More particles can clear the smaller hump, so the catalysed reaction runs faster even though the overall change is identical.
Analogy — Two paths over the same hill: the tunnel route needs far less climbing, so more hikers finish per hour.
Exam pointer — Show both humps on one diagram and label the lower one as the catalysed pathway.
Going deeper
The catalysed profile keeps the original reactant and product levels but offers a lower peak, so a greater proportion of molecules can achieve an effective collision. The catalysed reaction therefore completes faster while the overall enthalpy change stays exactly as before.
Analogy — Adding a chairlift does not move the mountain top, but far more skiers reach it each hour; the mountain is the reaction, the lift is the catalyst.
Exam pointer — State that the peak drops, not the levels, and link the drop to a greater proportion of effective collisions.
Checks
0 of 9 attempted · 0 correct
From the revision note
Diagrams on this note's page that are not tied to a specific lesson.
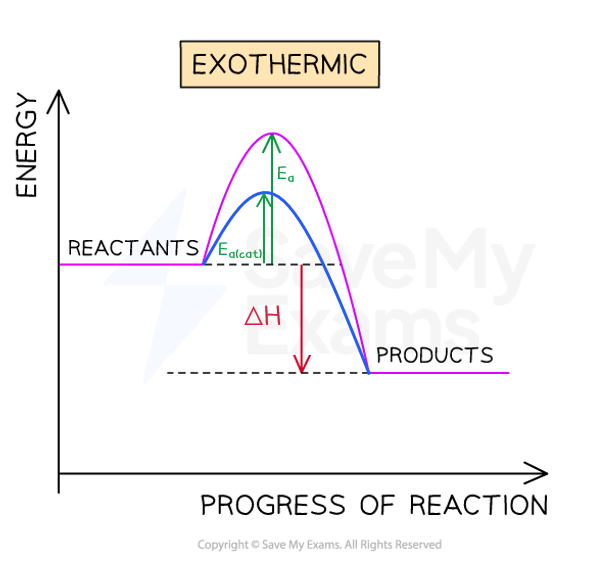
Catalysts lower the activation energy
Guided content from the SME authoring corpus — note rn_y85XYRv5QfgZFQxv, pinned at 51a6ed34e715 · promoted SyllabAI/syllabai-resources e967e75f1339