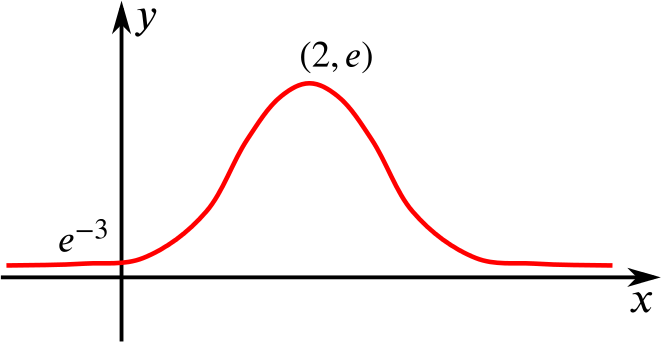
Can we sketch and describe these composite functions?
Question
- The functions and are defined by
Sketch in a single diagram the graphs of and the composite functions and , labelling each graph clearly. State briefly the relationship
- between the graphs of and ,
- between the graphs of and .
- Express in the form , where and are constants. State the coordinates of the maximum point on the graph of , and state what symmetry the graph possesses. Sketch the graph of .
Suggestion
How do we compose two functions together?
How does expressing in the form help us find the maximum value of ?
Things to look out for when sketching a curve:
- can I find the asymptotes?
- can I find the intercepts with the axes?
- can I find the stationary points and their nature?
- what happens to the curve as
Solution
First, we’ll find the composite functions and . We have and
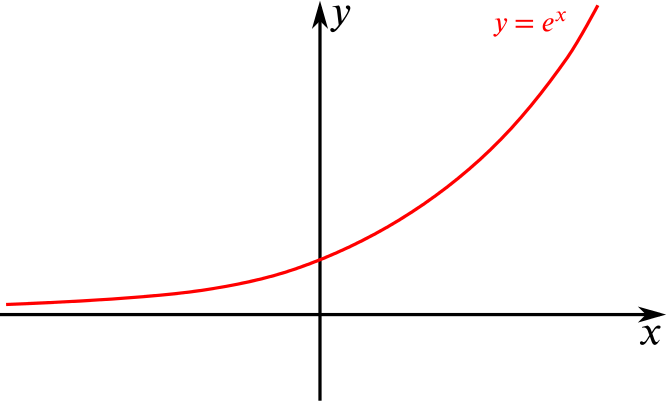
Let’s first sketch . We know that as , the graph crosses the -axis at and it is strictly increasing. So it looks roughly like this:
Now let’s add a sketch of . We know that this is a translation of by in the -direction, and that and cannot intersect. So our graph now looks like:
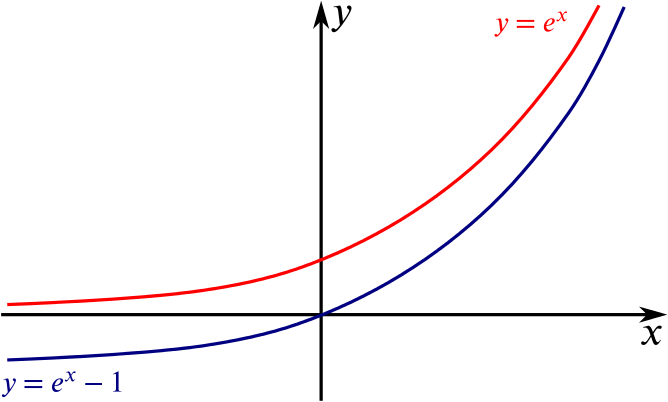
and
Finally, we add . This is a translation of by in the -direction. The graphs of and don’t meet, but does meet . So a sketch of the three functions looks like this:
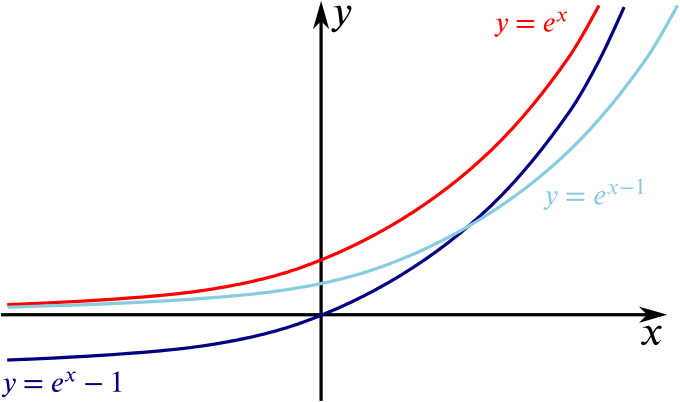
and and
The graph of is a translation of by one unit in the negative direction.
The graph of is a translation of by one unit in the positive direction.
We expand to obtain .
Completing the square, we find that
We could also do this by expanding both expressions and solving for and after comparing coefficients.
From the rewriting of the equation in the form , we see that the maximum point on the graph occurs when because the expression must be negative or zero. The expression is when so the maximum point has coordinates . The graph possesses line symmetry about .
So the graph
- has a maximum at , ;
- has symmetry about ;
- has its -intercept at ;
- sees as .
The sketch is