Revenue & Profit (Cambridge International A-Level Economics)
Revenue
- Revenue is the income a firm receives from selling goods or services
Different types of revenue
1. Total revenue
- Total revenue is the total income received from selling output
-
Where:
- P = price per unit
- Q = quantity sold
-
As output increases, total revenue changes depending on price and demand conditions
2. Average revenue
- Average revenue is the revenue earned per unit of output sold
- Average revenue is usually equal to the price of the good
- For this reason, the average revenue curve is the firm’s demand curve
3. Marginal revenue
- Marginal revenue is the additional revenue gained from selling one more unit of output
- When price must fall to sell additional output, MR falls faster than AR
- As output increases, MR eventually becomes zero or negative
Relationship between AR and MR
- AR represents the price consumers are willing to pay
- When firms must lower price to sell more units, MR lies below the AR curve
- MR falls faster because the price reduction applies to all units sold
Worked Example Revenue calculations
Price (P) Quantity (Q) Total revenue (TR = P × Q) Average revenue (AR = TR ÷ Q) Marginal revenue (MR = ΔTR ÷ ΔQ) 8 1 8 8 8 7 2 14 7 6 6 3 18 6 4 5 4 20 5 2 4 5 20 4 0 3 6 18 3 -2 What the table shows
- Total revenue initially increases as output increases
- When marginal revenue becomes zero, total revenue is maximised
- When marginal revenue becomes negative, total revenue begins to fall
- Average revenue equals price
Profit
Types of profit
1. Supernormal profit
- Supernormal profit occurs when:
TR>TC
- This means the firm earns more than the minimum required to remain in the industry
- Firms in the market may attract new entrants
- This is also known as economic profit
2. Normal profit
- Normal profit occurs when:
TR=TC
-
The firm covers all explicit and implicit costs
- Implicit costs are the opportunity costs of production
- Explicit costs are the costs which have to be paid e.g raw materials, wages etc.
- Implicit costs must be considered, as entrepreneurs will rationally reallocate resources when greater profits can be made elsewhere
-
The firm earns just enough to remain in the industry
3. Subnormal profit (loss)
- Subnormal profit occurs when:
TR<TC
- The firm is making a loss
- If losses persist, firms may exit the market
Worked Example Profit calculations
Output (Q) Total revenue (TR) Total cost (TC) Profit (TR − TC) 5 150 90 60 6 180 96 84 7 210 210 0 8 240 260 -20 What the table shows
- Profit is maximised at Q = 6, where the difference between TR and TC is greatest
- At Q = 7, the firm earns normal profit (TR = TC)
- At Q = 8, the firm makes a subnormal profit (loss)
Revenue, costs and supernormal profit
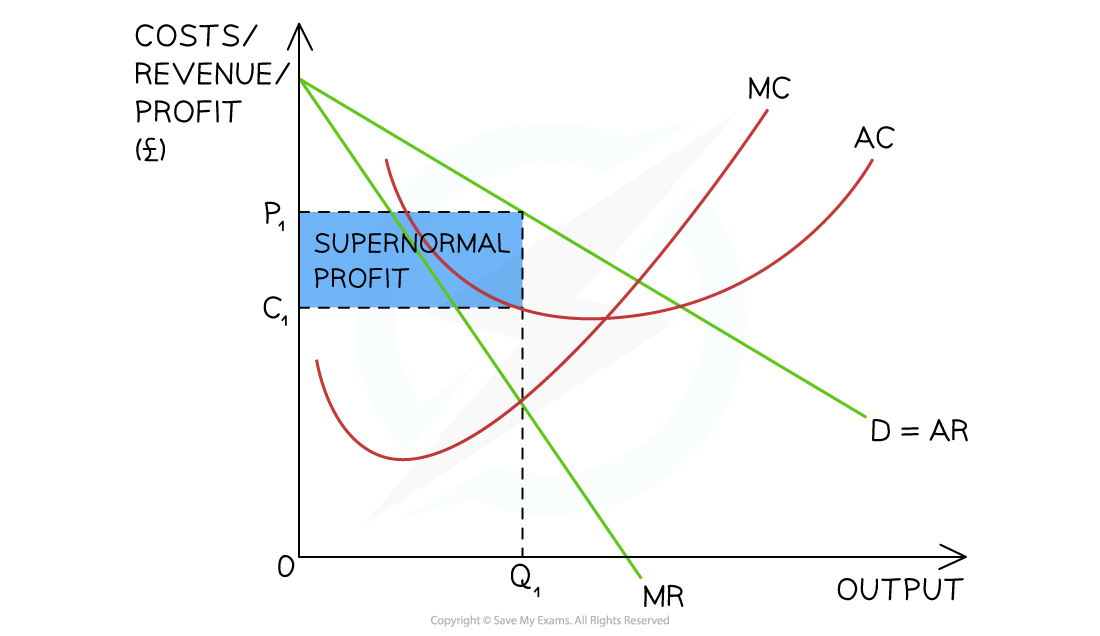
Diagram analysis
-
The diagram illustrates how firms determine profit-maximising output
-
The firm maximises profit where marginal revenue equals marginal cost (MR = MC)
- This determines the profit-maximising output level Q₁
-
At this output:
- The firm charges price P₁, determined by the AR (demand) curve
- The firm’s average cost is C₁
-
Because P₁ is greater than AC, the firm earns supernormal profit
-
The shaded rectangle represents the total supernormal profit:
- Height = P₁ − C1
- Width = Q₁
-
If price were equal to C1, the firm would earn normal profit
-
If price were below C1, the firm would earn subnormal profit (loss)
Was this revision note helpful?
Build on this topic