Interpreting Rf Values in GL Chromatography (Cambridge International A-Level Chemistry)
Exam board Cambridge International · A-LevelUpdated 2026-07-02
Interpreting Rf Values in GL Chromatography
Features of a gas-liquid chromatogram
- Peaks represent different molecules from the sample - each roughly taking the shape of a triangle
- The area under each peak is the relative concentration of each component (the peak integration value)
Area under the peak = ½ x base x height
- If the area under each peak is very small or too difficult to decipher, the height of the peaks are used for further analysis
Calculating areas under curves on a gas chromatogram
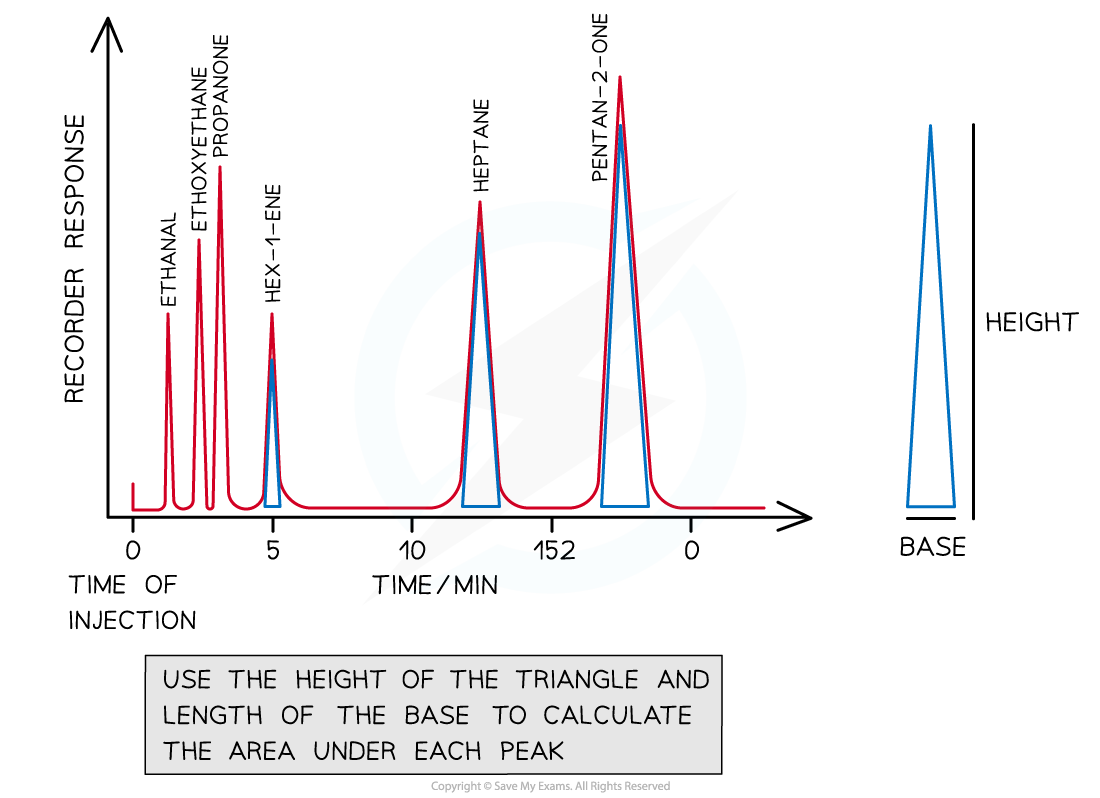
To find the area under each peak, treat each peak as a triangle - see the examples shown using blue triangles in the diagram
Percentage composition of a mixture
- We can calculate the amount of a particular molecule in a sample by using an expression
- If a chromatogram shows peaks for alcohols A, B, C and D, to calculate the % composition of alcohol C, use this expression:
equation
Explaining Retention Times
-
Retention time is the time taken for a sample molecule to travel through the column, from the time it is inserted into the machine to the time it is detected
-
Molecules in the gaseous mixture travel at different rates, therefore giving rise to different retention times
-
Longer retention times are associated with:
- Non-polar components in the mixture
- They are more attracted to the non-polar liquid in the stationary phase
- So non-polar molecules travel slower through the column
-
Shorter retention times are associated with:
- Polar components in the mixture that prefer to interact with the carrier gas
- They are less attracted to the non-polar liquid in the stationary phase
- So polar molecules travel faster through the column
- These molecules may have lower boiling points and, therefore, are vapourised more readily
Was this revision note helpful?
Build on this topic