Economic Activity & Energy Enquiry Skills (Edexcel IGCSE Geography)
The Energy Enquiry Fieldwork Report
Spec point —
4GE1-S9.128
The fieldwork report
Energy enquiry data presentation
- Data presentation may take many forms
Primary data
-
Much of the primary data collected in an energy development enquiry will be presented in the form of graphs:
- Each type of graph is suitable for particular data sets
- The graphs all have strengths and limitations
-
Suitable graphs for an energy enquiry include:
- Bar graphs to compare environmental quality scores at different sites
- Scattergraphs to show whether there is a relationship between distance from the energy development and environmental quality
- Pie charts can be used to show people's views and opinions regarding energy development
-
Data presentation may also include:
- Maps to show sample site location
- Maps with proportional circles to show different opinions towards the energy development at different sites
Worked Example Study Figure 1a shows the results from a questionnaire carried out as part of a student's geographical enquiry.
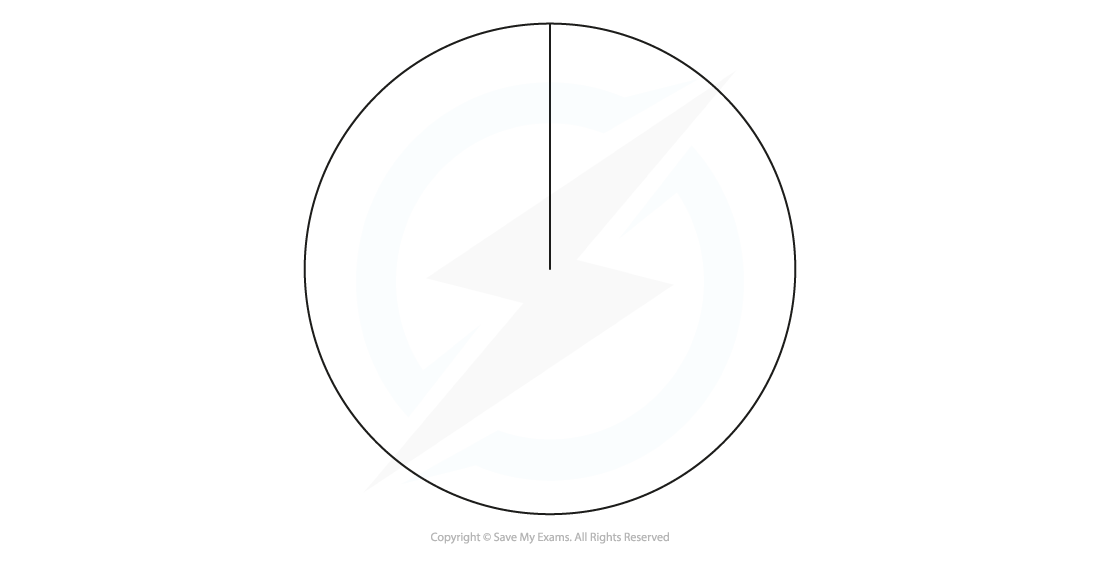
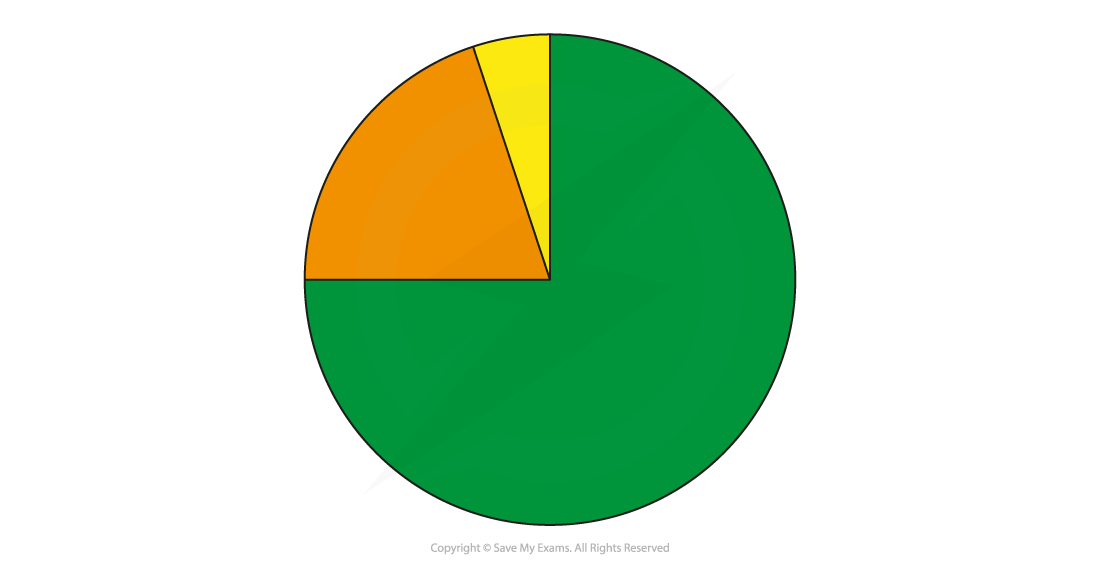
Use the data for the questionnaire for question 3 to complete Figure 1b
[2 marks]
**Figure 1a - Responses to the Questionnaire **
Yes (%) No (%) Not Sure (%) Question 1 - Do you think that the renewable energy plant has improved the area? 30 50 20 Question 2 - Are you local to this area? 85 15 0 Question 3 - Do you think traffic has increased due to the new renewable energy plant? 75 5 20
Figure 1b - Questionnaire answer to question 3
Answer:
- 75% for 'yes' is 270°
- 5% for 'no' is 18°
- 20% for 'not sure' is 72° (2)
Exam Hint
In the exam, you may be asked to complete a pie chart or complete an unfinished graph
When completing a pie chart graph:
- Take your time to ensure that you have marked the date accurately
- On a pie chart, every 1% is 3.6°
- Use the same style as the data which is already on the exam paper
- If it is a pie chart, it will have a key to show you how to shade the different segments of the graph
- Make sure that you follow the key
Secondary data
-
Any fieldwork should include secondary data as well as primary data
-
In an energy enquiry, suitable secondary data may include:
- Maps of the area where the land use change has occurred
- Newspaper/website articles about energy source development
- Aerial photographs
Worked Example You have studied economic activity and energy as part of your geographical enquiry
**(i) State one type of secondary data you have used in your geographical enquiry **
[1 mark]**
Answer:
Any one from:
- Newspaper****
- GIS map/paper map
- Book/magazine
- Government report/policy document
- Blog / forum / social media** **
(ii) Explain one way this secondary data helped you when investigating an energy development
[2 marks]
Answer:
- It allowed us to find out about spatial variation in the area of study [1] so that we knew that we would get good spatial coverage to minimise bias** [1]**
- Stratified sampling was used, as we had census data about the town population** [1] so we could design a fair sampling frame for the questionnaire about the energy development that we were investigating [1]
- Historical photographs enabled us to see the site before the energy development [1] so we could compare it to the current development [1]
- Websites and social media included points of views and opinions about the land-use change [1] so that we could use these together with the questionnaire data [1]
Analysing & Interpreting Energy Fieldwork Data
Spec point —
4GE1-S9.128
Analysing & interpreting data
- Once all the data has been collected and presented, it needs to be analysed
- The data which is collected regarding energy development, such as questionnaires and environmental quality surveys, is quantitative and will be analysed using statistical methods
- One of the main statistical methods that may be used is the mean
Worked Example Outline one named quantitative technique which might have been used to analyse the fieldwork information
[3 marks]
Answer:
- Mean [1]: Calculate the mean for several fieldwork sites. [1] Using more data and calculating the mean increases the validity of the data
- Mode [1] calculate mode for several questionnaire results [1] to identify the most common result [1]
- Median [1] calculate the median for several fieldwork sites [1]
- Best-fit line [1] to identify the trend [1] in the relationship between two variables [1]
- Correlation [1] correlates two variables [1], negative correlation as one factor increases, the other falls [1]
Analysing photographs and field sketches
-
The use of photographs and field sketches is a qualitative analysis
-
Photographs and field sketches can be used in an energy enquiry to analyse and interpret several different features:
- The change caused by the energy development
- Data collection techniques
- Images to support the other data collection techniques
Worked Example **Explain two methods you used to analyse some of your fieldwork data **
[4 marks]
Answer:
- Quantitative tools such as mean and median** [1]** so that we could find measures of centrality in our data [1]
- Annotated sketches based on photographs from the fieldwork were used [1] and the selected annotations were able to highlight characteristics and processes [1]
- A computer spreadsheet was used to calculate the spread and range in our questionnaire data [1] so that we could compare outcomes between different sample sites [1]
Conclusion
-
Once the data has been analysed, conclusions can be reached
-
The conclusion should state whether the hypothesis has been proven or disproved
-
Identify and explain any anomalies such as:
- In one area people strongly disagree that energy development is beneficial, whereas in all other areas, they strongly agree or agree
-
Anomalies may occur due to a natural cause or maybe the result of incorrect recording or human error
Evaluation
-
The final stage of the energy enquiry is the evaluation, which outlines how successful or not the energy enquiry has been and what could be done differently were it to be repeated. For example:
- Next time I would take measurements or complete the surveys in more areas to ensure the reliability of the data...
- If I were to repeat the study, I would test my questionnaires using a pilot study to ensure all the questions were clear...
- I think my enquiry went well, and I would like to repeat it after the energy development has been in place for some time to see if the results change...
Exam Hint
The 8-mark fieldwork question is often an evaluation of your enquiry or unfamiliar fieldwork. The evaluation could involve data collection, data analysis, or your conclusion. The key factors to remember to include in your answer are:
- What went well? How do you know that your results were accurate and therefore valid?
- Is the enquiry reliable – could it be repeated and the same results achieved?
- What could have been improved?
- What would you do if you were to repeat the enquiry?
Was this revision note helpful?