Exponential Functions (Edexcel IGCSE Further Maths)
Exponential Functions & Graphs
Spec point —
4A
What is an exponential function?
-
An exponential function is of the form
-
Its domain is the set of all real numbers
-
Its range is the set of all positive real numbers
-
An important exponential function is
- e is the mathematical constant
- See the following note on "" for more details
What are the key features of exponential graphs?
-
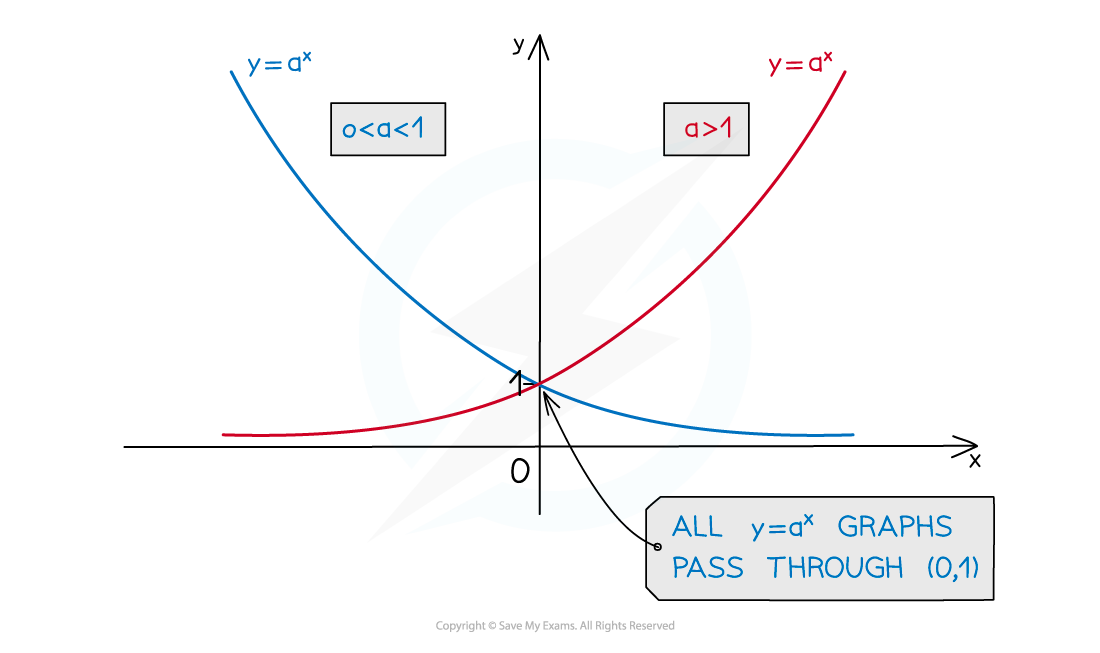
The graphs have a -intercept at
- Because
-
The graph will always pass through the point
- Because
-
The graphs do not intersect the-axis
- The graphs have a horizontal asymptote at the x-axis
-
The graphs do not have any minimum or maximum points
-
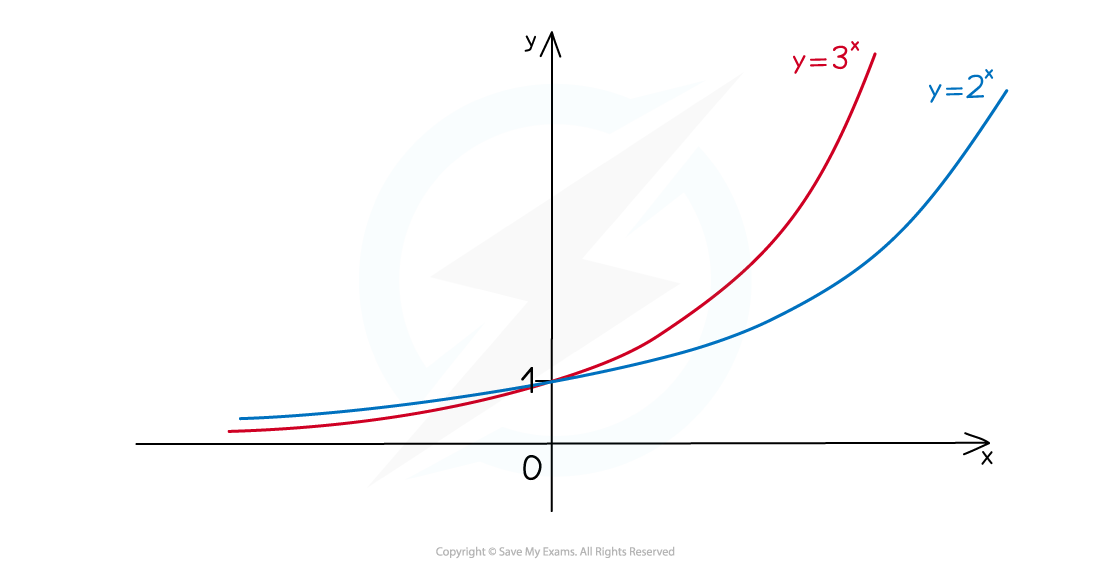
When
- For the higher value of is the “lower” graph
- Where the higher value of is the “higher” graph
-
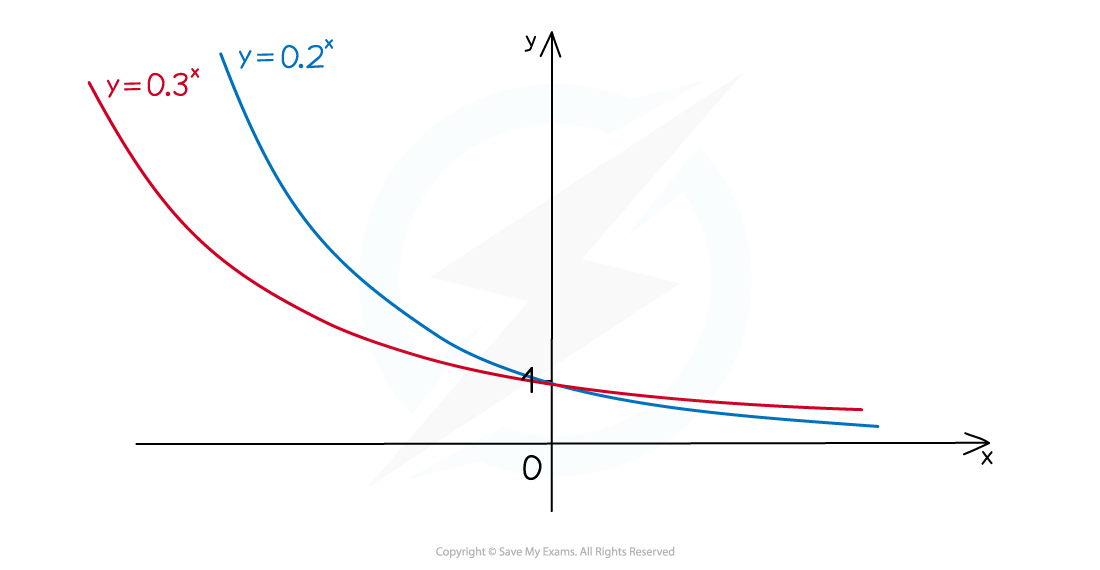
When
- Where the higher value of is the “lower” graph
- Where the higher value of is the “higher” graph
-
When
- The graph is a horizontal line through
- Because for all values of
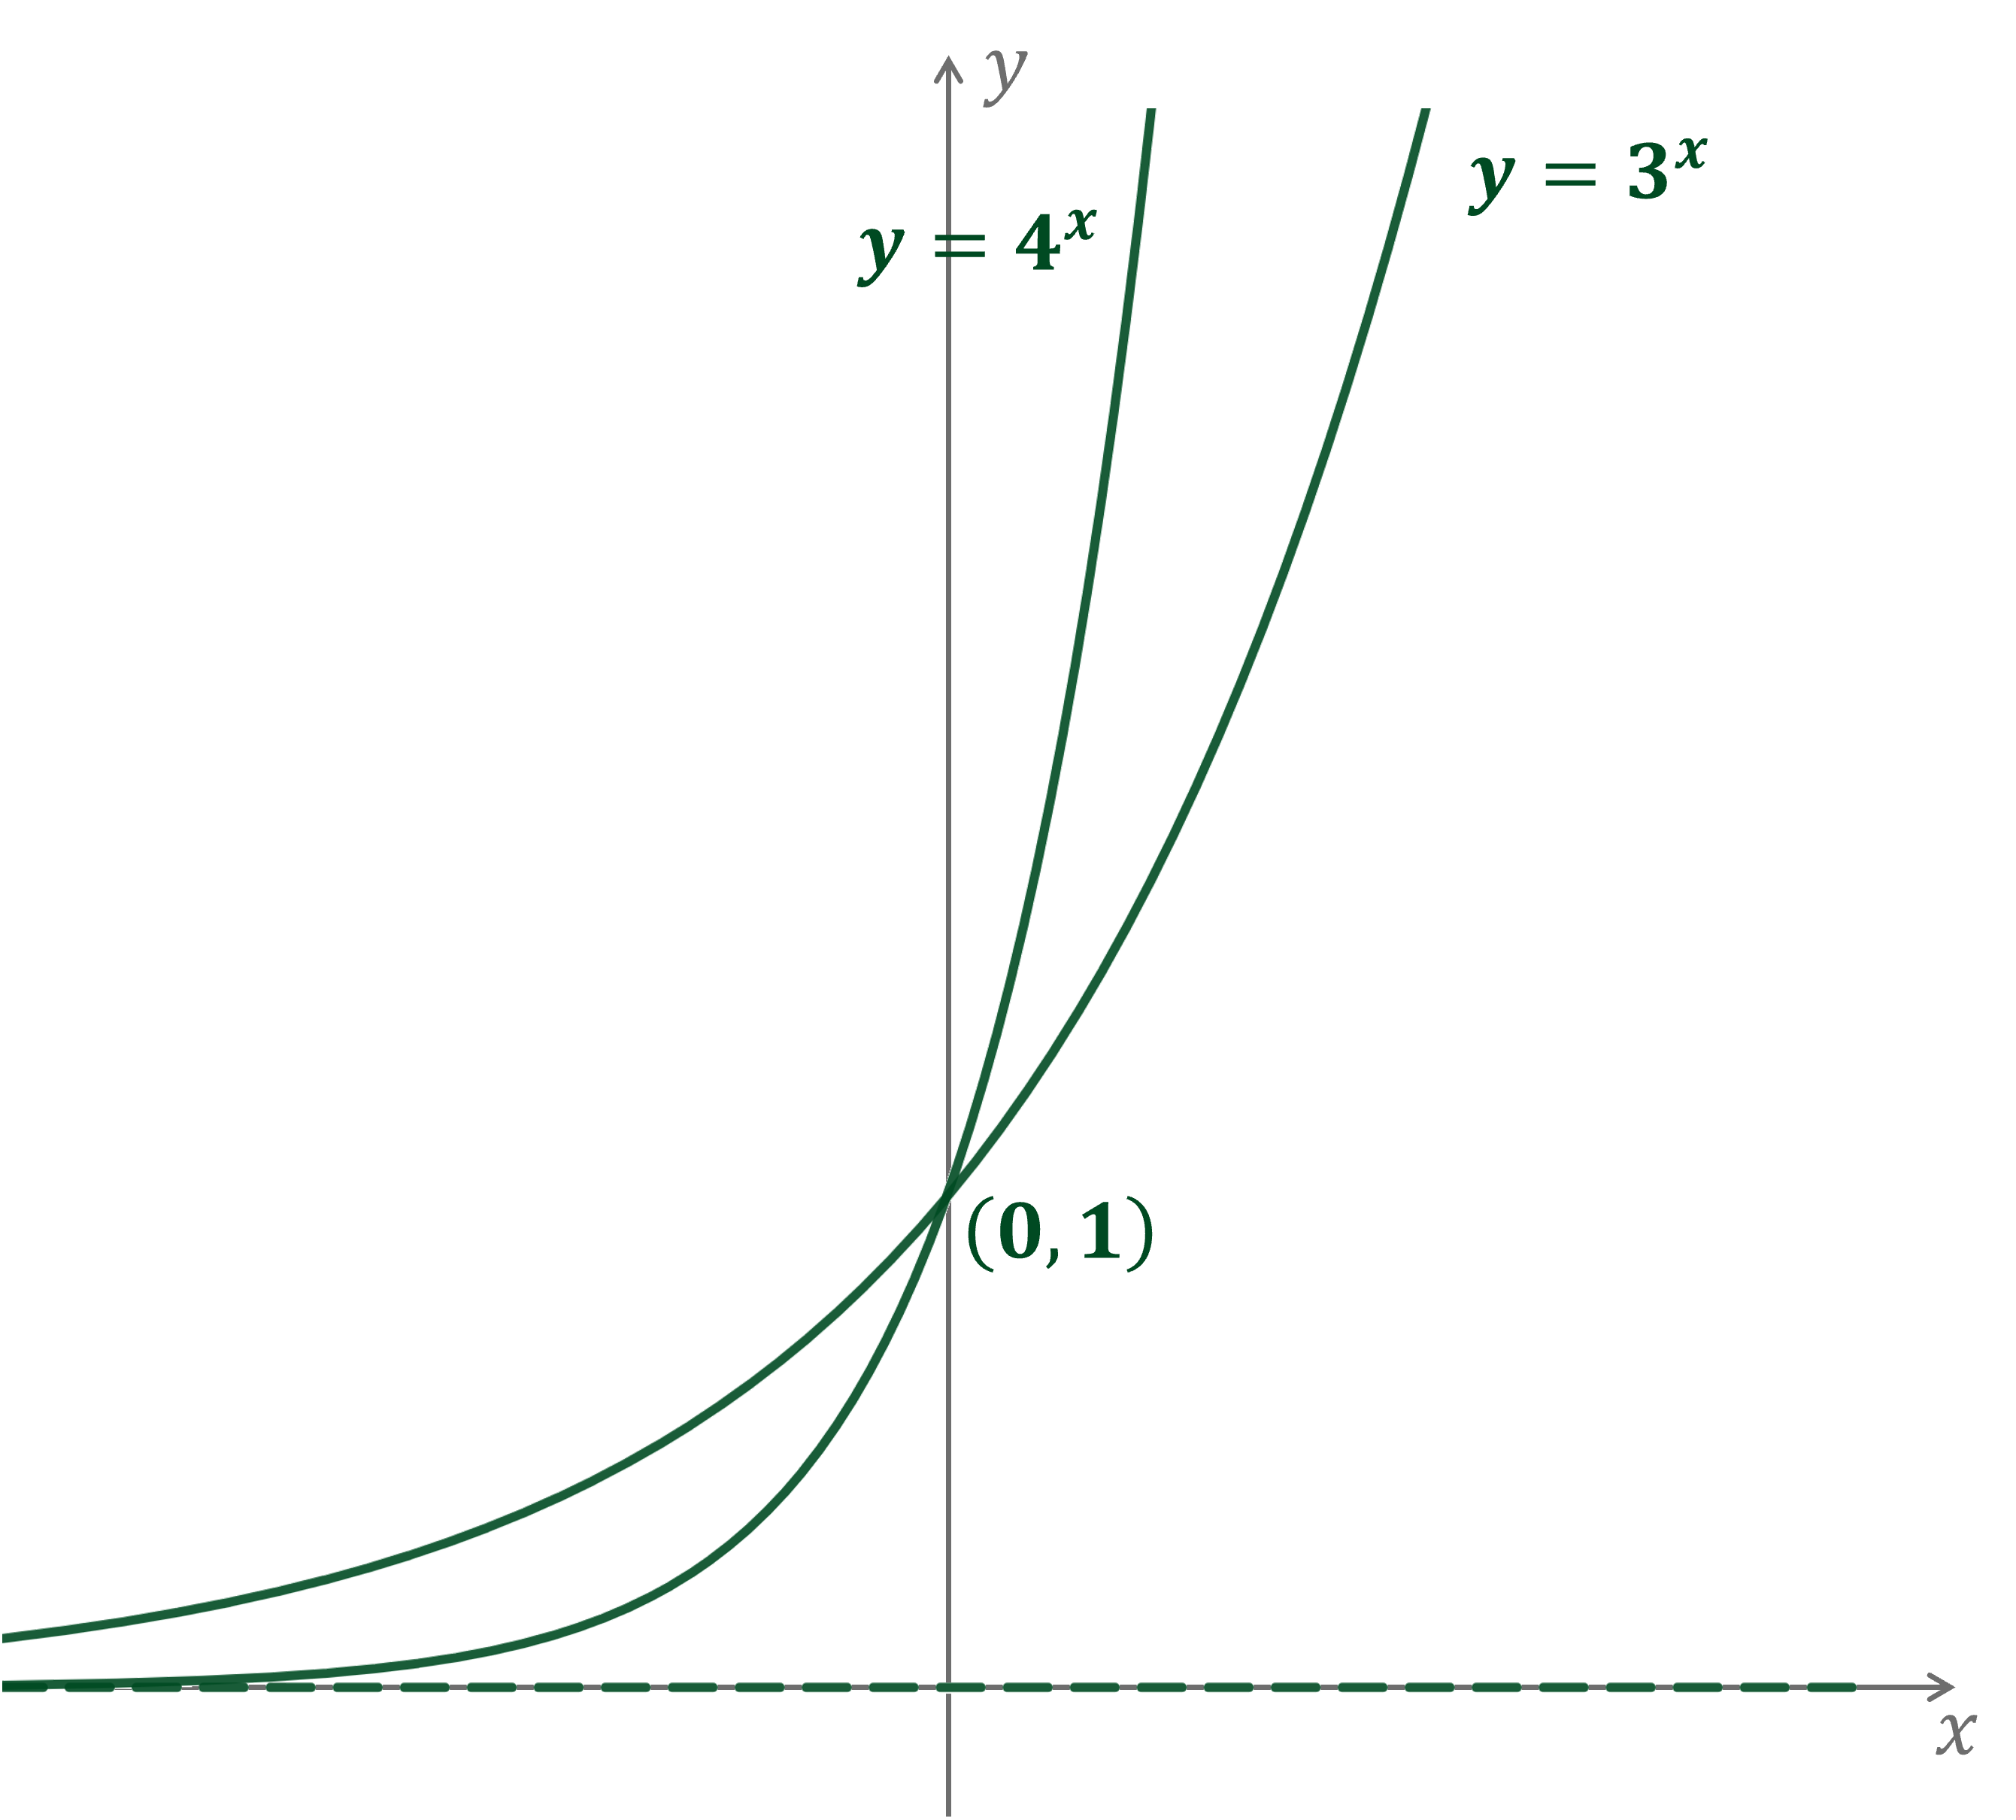
Worked Example On the same set of axes, sketch the graphs of and .
Both graphs will have the 'typical' exponential shape for the case
will be the 'lower' graph for ,and the 'higher' graph for
Both graphs go through and have an asymptote at the -axis
"e"
What is e, the exponential constant?
-
is one of the most important mathematical constants
- is an irrational number
- is often referred to as 'the exponential function'
-
As with other exponential graphs,
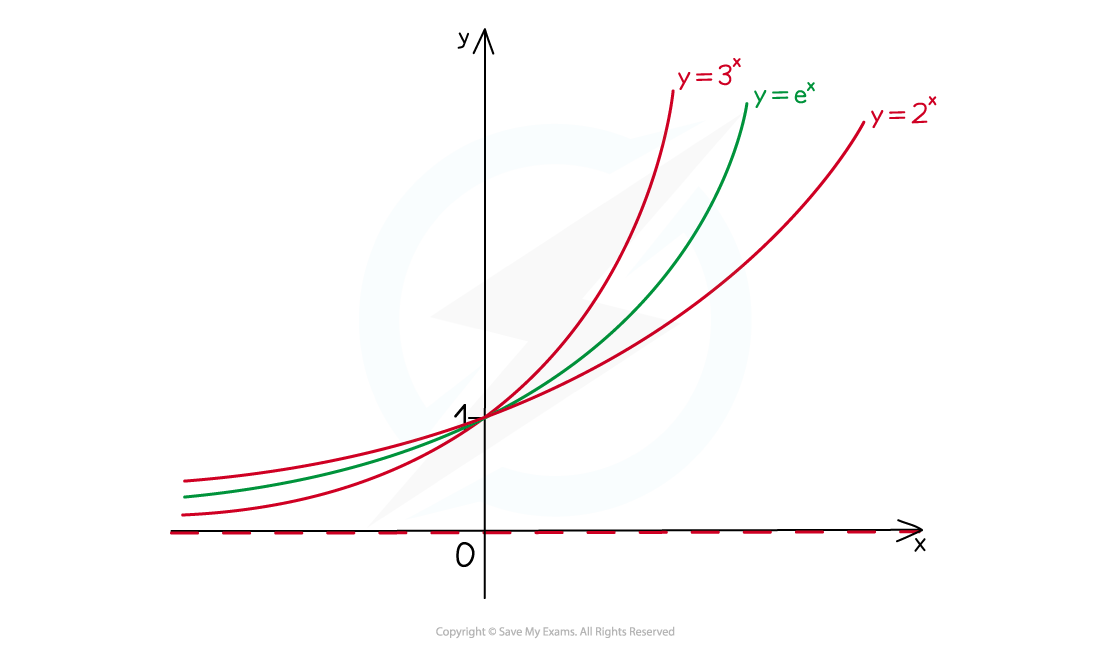
- passes through
- has the -axis as an asymptote
Why is e so important?
-
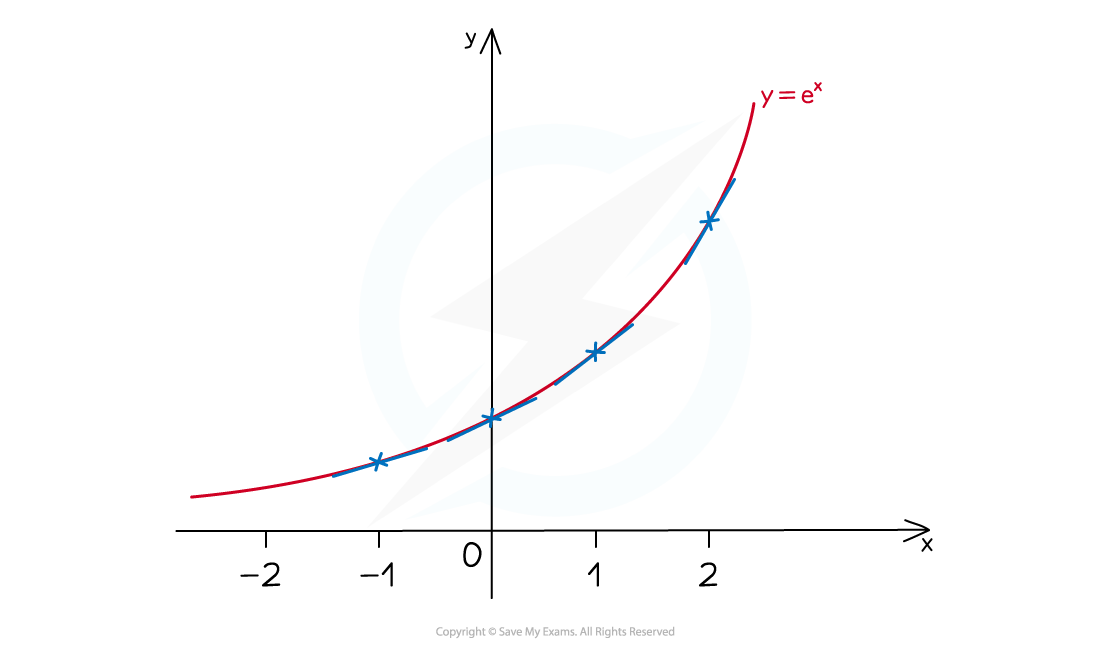
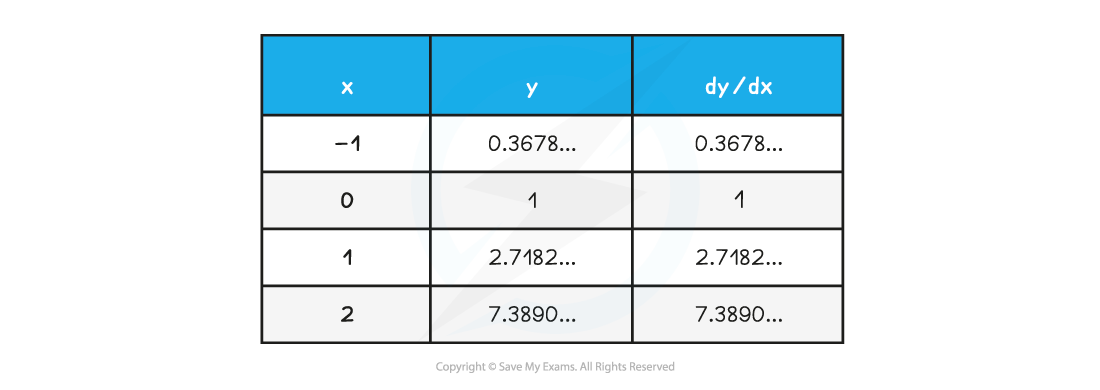
has the particular property that
- i.e. if , then is also equal to
-
This means that for every real number , the gradient of is also equal to
The negative exponential graph
-
is a reflection in the -axis of
- Note by laws of indices that
e ^ - x = ( e ^ - 1 ) ^ x = ( 1 / e ) ^ x
- Note by laws of indices that
-
They are of the form and
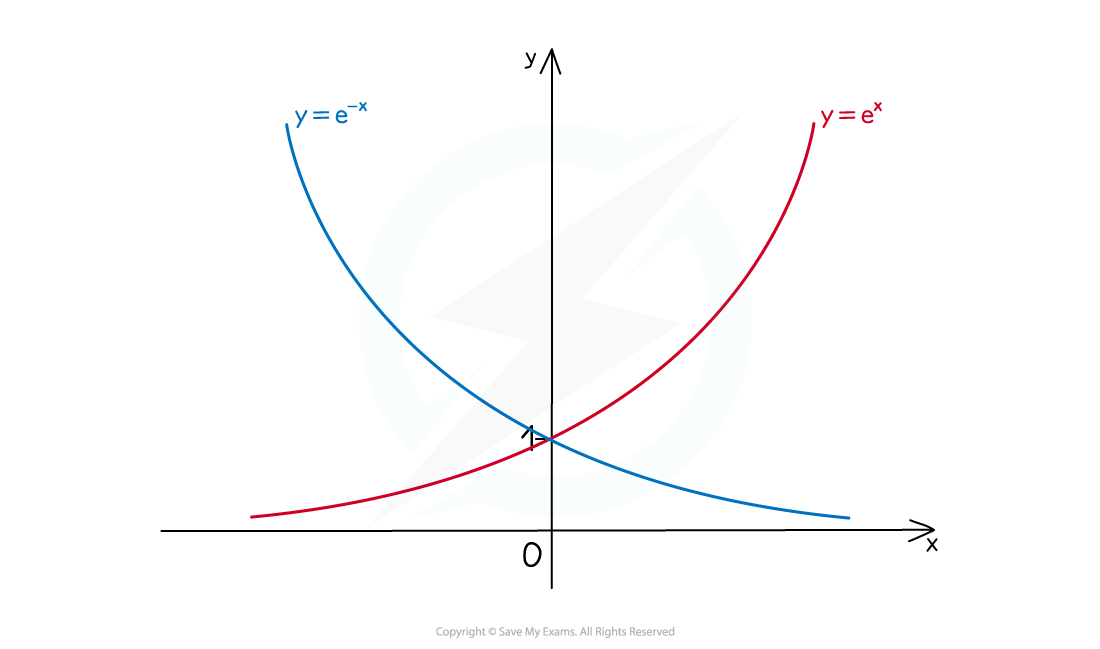
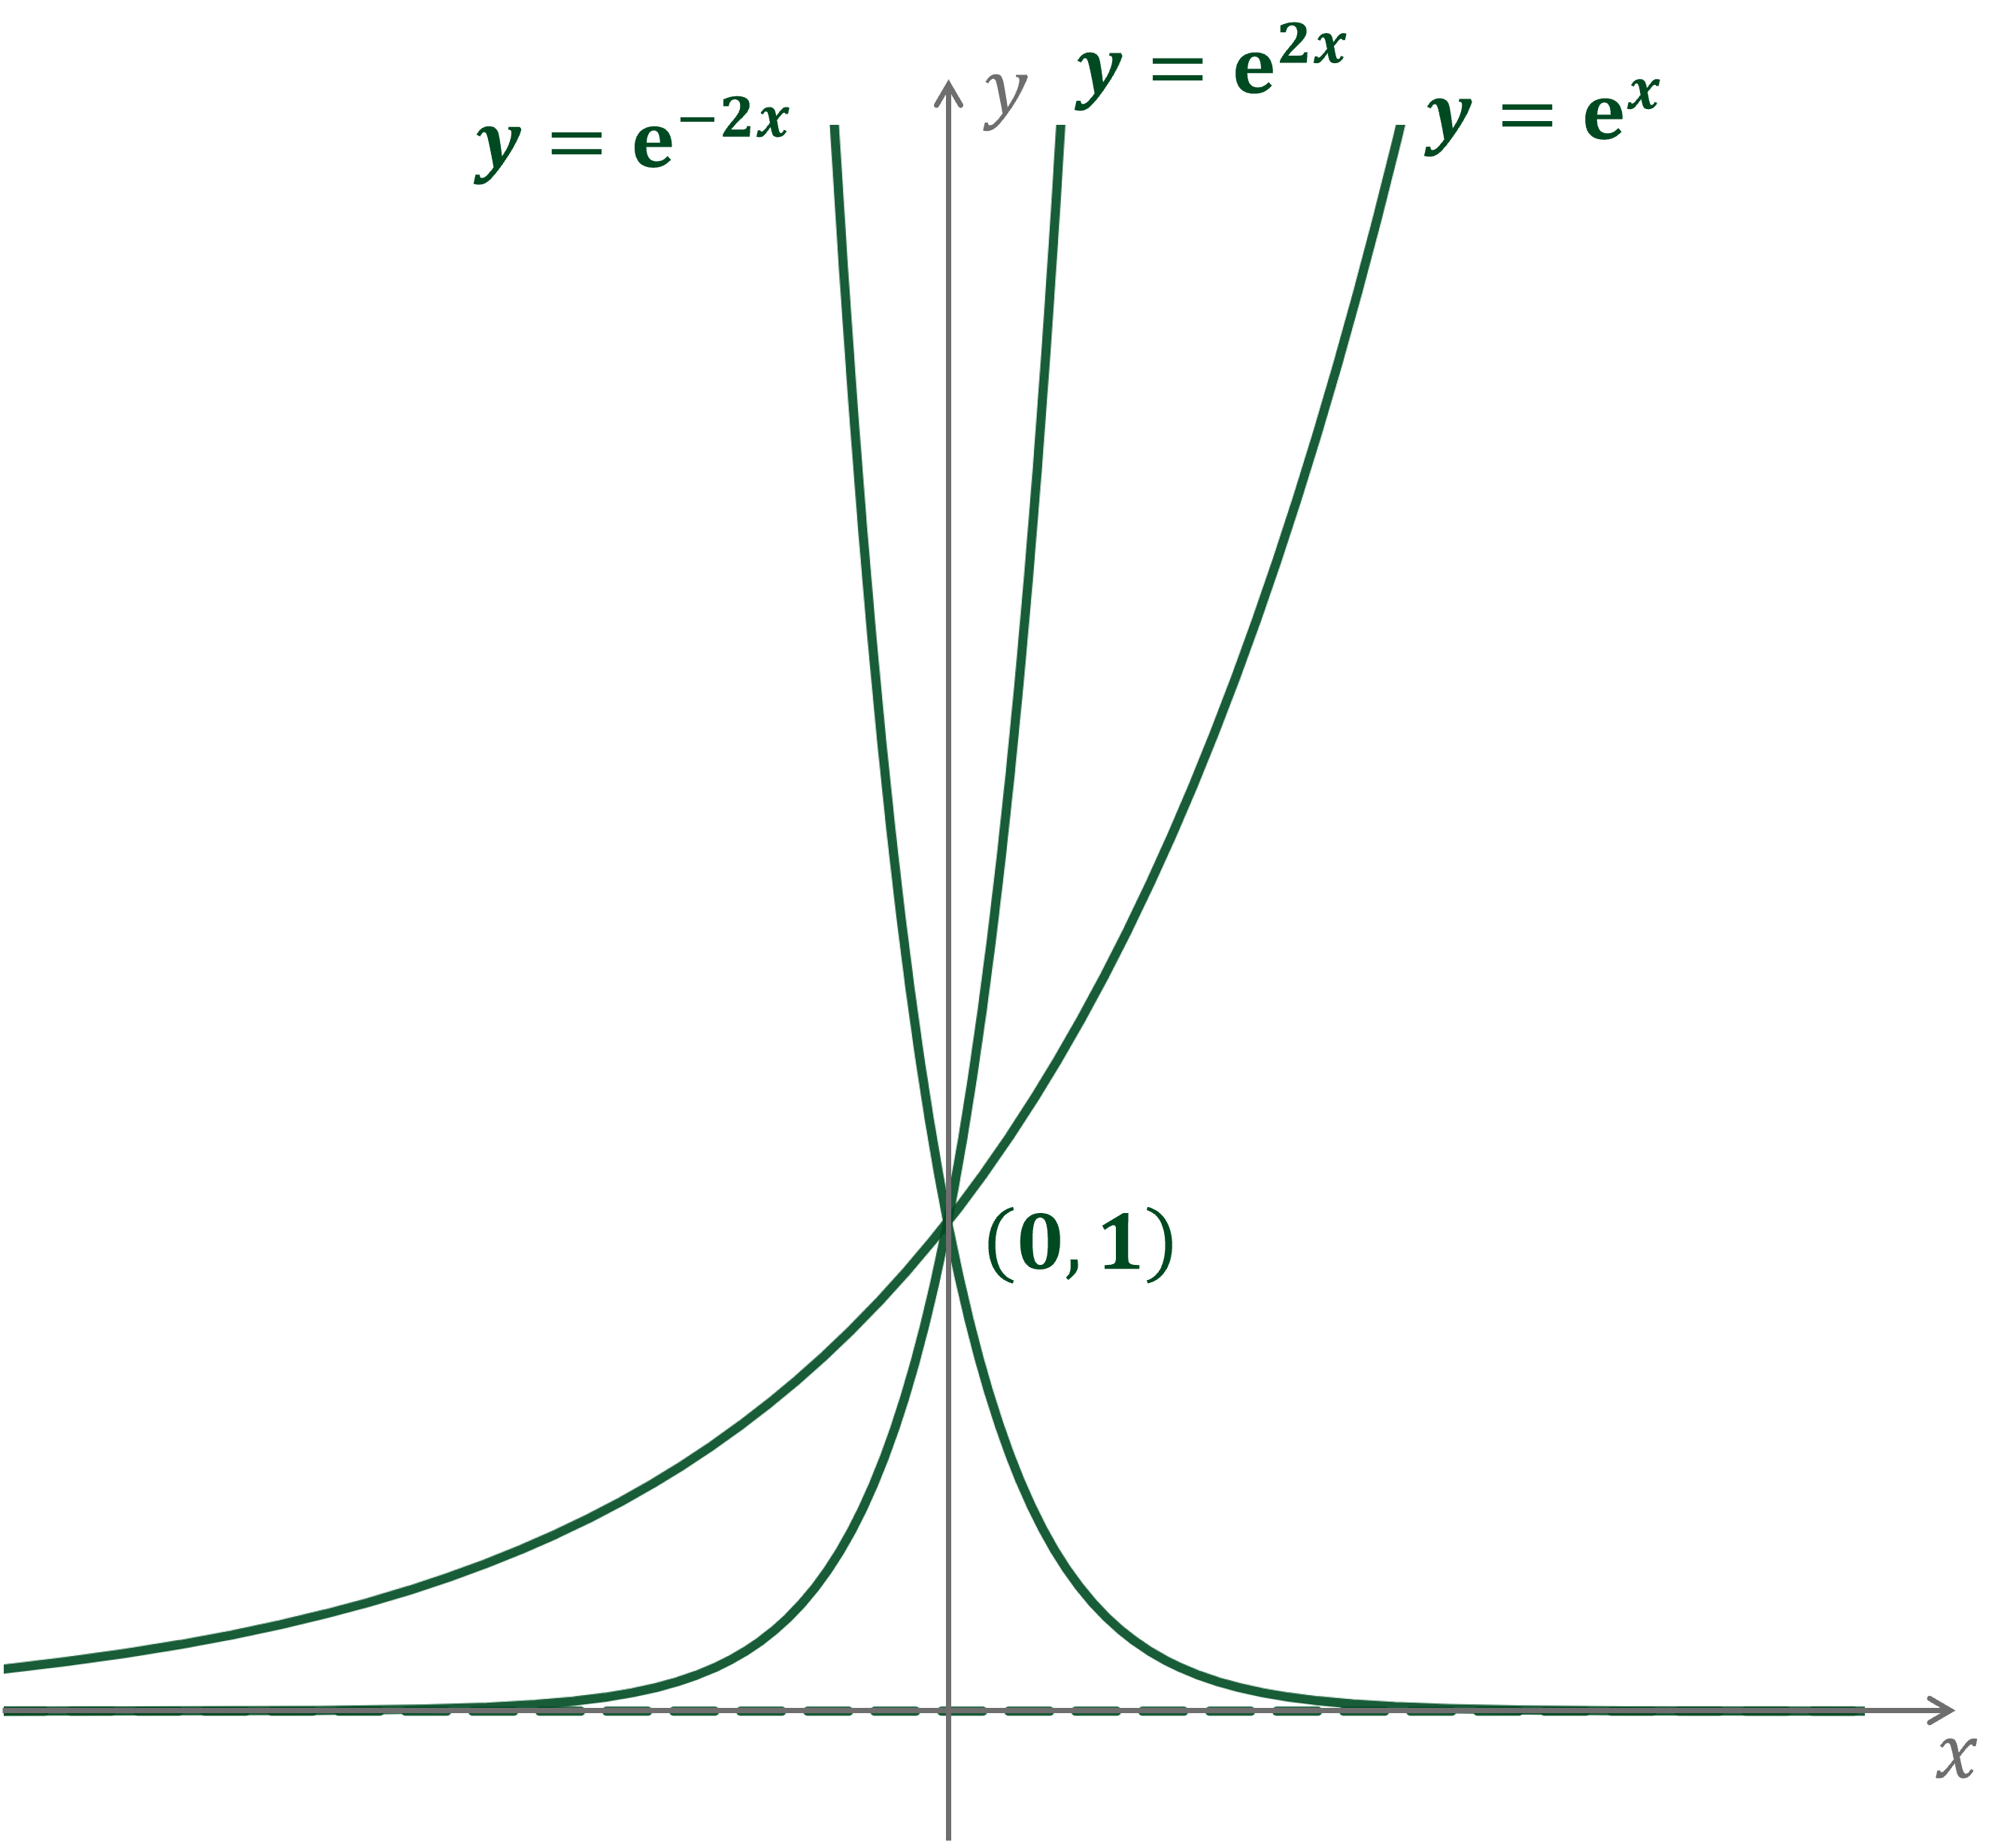
Worked Example On the same set of axes, sketch the graphs of , and .
By laws of indices,
, so will be the 'lower' graph for ,and the 'higher' graph for
is the reflection of in the -axis
All three graphs go through and have an asymptote at the -axis
Was this revision note helpful?
Build on this topic