Break-even Charts (Edexcel IGCSE Business)
Elements of break-even charts
Spec point —
3.3.3· Interpretation of break-even charts:
-
A break-even chart is a visual representation of the break-even point in a graph
-
Three lines are plotted on a graph with an x-axis labelled units and a y axis labelled costs/revenues
- Fixed costs
- Total costs
- Revenue
-
The break-even point is the output level at which the revenue and total costs line cross
-
The break-even chart can also be used to identify the following
-
Profit or loss at different levels of output
- Profit is achieved when revenue is greater than total costs
- A loss occurs when total costs are greater than revenue
-
The margin of safety, which is the difference between the actual level of output and the break-even point
-
Interpreting break-even charts
Spec point —
3.3.3· Interpretation of break-even charts:
-
The elements can be identified in the break-even chart below
- The selling price is £32 per unit
- Variable costs are £7.60 per unit
- Fixed costs are £8,000
Break-even chart with key elements
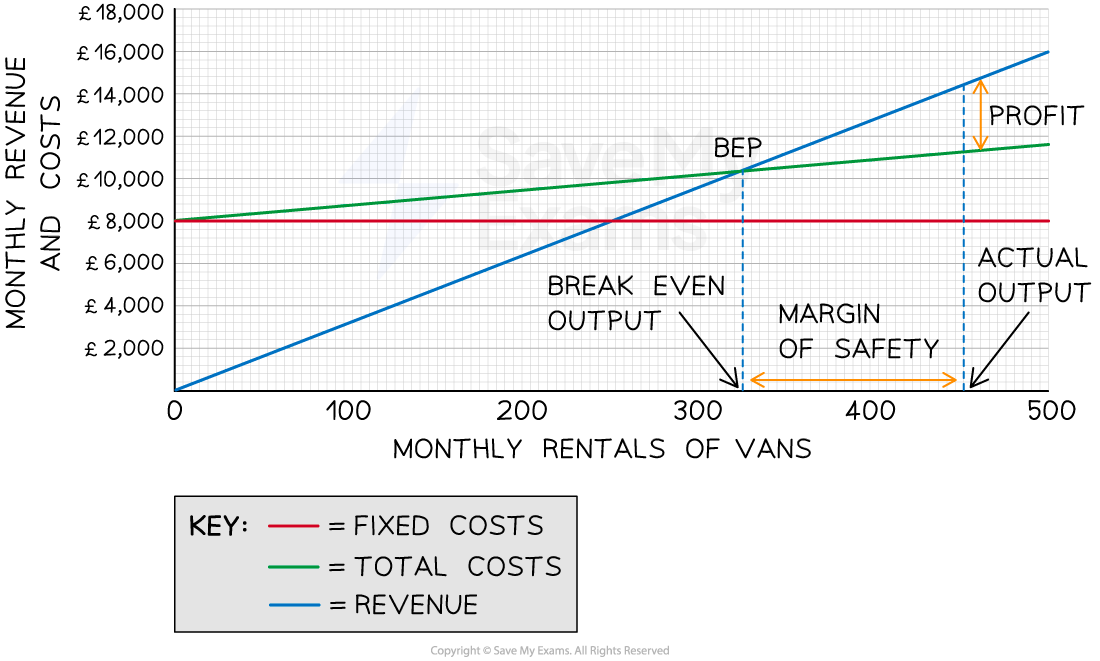
*The break-even chart shows the break-even point, profit at a given level of output and the margin of safety *
-
Fixed costs do not change as output increases
- Fixed costs are £8,000 and these do not change whether the business produces 0 units or 500 units
- It is therefore represented by a horizontal line at £8,000 for all levels of output
-
Total costs are made up of fixed and variable costs
Fixed, variable and total costs at different levels of output
| Units | 0 | 100 | 200 | 300 | 400 | 500 |
|---|---|---|---|---|---|---|
| Variable costs (£) | 0 | 760 | 1,520 | 2,280 | 3,040 | 3,800 |
| Fixed costs (£) | 8,000 | 8,000 | 8,000 | 8,000 | 8,000 | 8,000 |
| Total costs (£) | 8,000 | 8,760 | 9,520 | 10,280 | 11,040 | 11,800 |
- At 0 units of output, total costs are made up exclusively of fixed costs
- At 500 units, the total costs are £11,800
equals space £ 3 comma 800
Total space Costs space equals space Fixed space Costs space plus space Total space Variable space Costs
equals space £ 8 comma 000 space plus space £ 3 comma 800
equals space £ 11 comma 800
- In the chart, the total costs line slopes upwards because total variable costs increase as output increases
- Revenue is the quantity sold x selling price
Revenue at different levels of output
| Units | 0 | 100 | 200 | 300 | 400 | 500 |
|---|---|---|---|---|---|---|
| Revenue (£) | 0 | 3,200 | 6,400 | 9,600 | 12,800 | 16,000 |
-
The revenue line also slopes upwards
- At 0 units of output, the revenue is £0
- At 500 units the total revenue equates to £16,000
- Revenue increases with output
- The line will slope more steeply than the total costs and will cross the total costs line at some point
-
The point at which the total costs and the revenue lines cross is the break-even point
- The break-even level of output is 328 units
-
The margin of safety can be identified as the difference on the x-axis between the actual level of output (in this case, 450 units) and the break-even point
- The margin of safety is 450 - 328 = 122 units
-
The profit made at a specific level of output can be identified as the space between the revenue and total costs lines
- In this instance, the profit made at 450 units of output is £14,400 - £11,420 = £2,980
Exam Hint You will not be required to draw a break-even chart in the exam but you could be asked to manipulate a diagram that has been provided
You could be asked to
- Illustrate a change to the selling price, variable costs or fixed costs on the diagram
- Mark the break-even point or margin of safety
- Identify the amount of profit (or loss) made at a given level of output
- Label elements such as axis names or cost/revenue curves
The impact of changes in revenue and costs
Spec point —
3.3.3· Interpretation of break-even charts: • the impact of changes in revenue and costs
The impact of changes in revenue and costs
- Changing in the selling price, variable cost per unit or total fixed costs affects the break-even point and level of profit or loss
How the break-even point and level of profit is affected by changes in variables
| Increased selling price | Decreased selling price |
|---|---|
- An increase in the selling price reduces the break-even point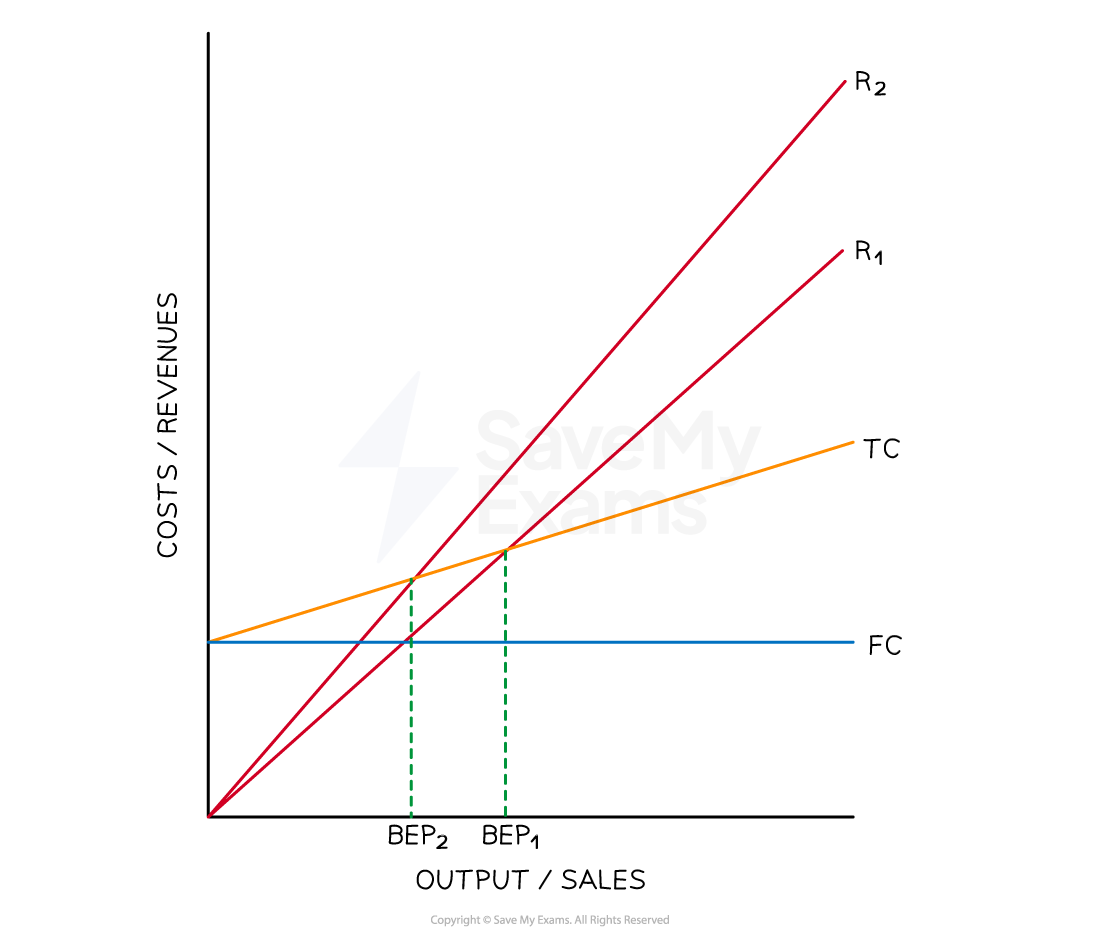 - An increase in the selling price increases revenue at each level of output, from R1 to R2 - The break-even point falls from BEP1 to BEP2 - Profit on each unit of output greater than the break-even point is increased | - A decrease in the selling price increases the break-even point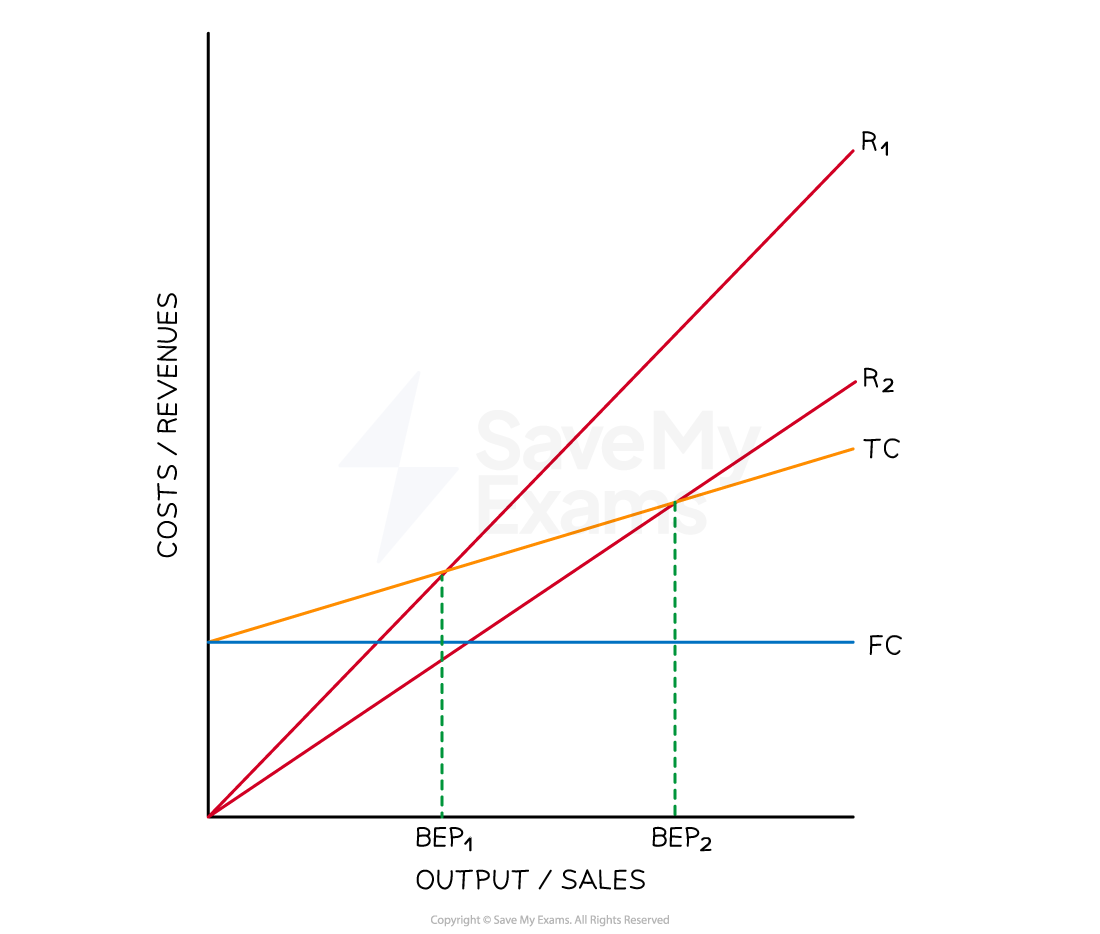 - A decrease in the selling price reduces revenue at each level of output, from R1 to R2 - The break-even point rises from BEP1 to BEP2 - Profit on each unit of output greater than the break-even point is decreased |
| Increased variable costs | Decreased variable costs |
- An increase in variable costs increases the break-even point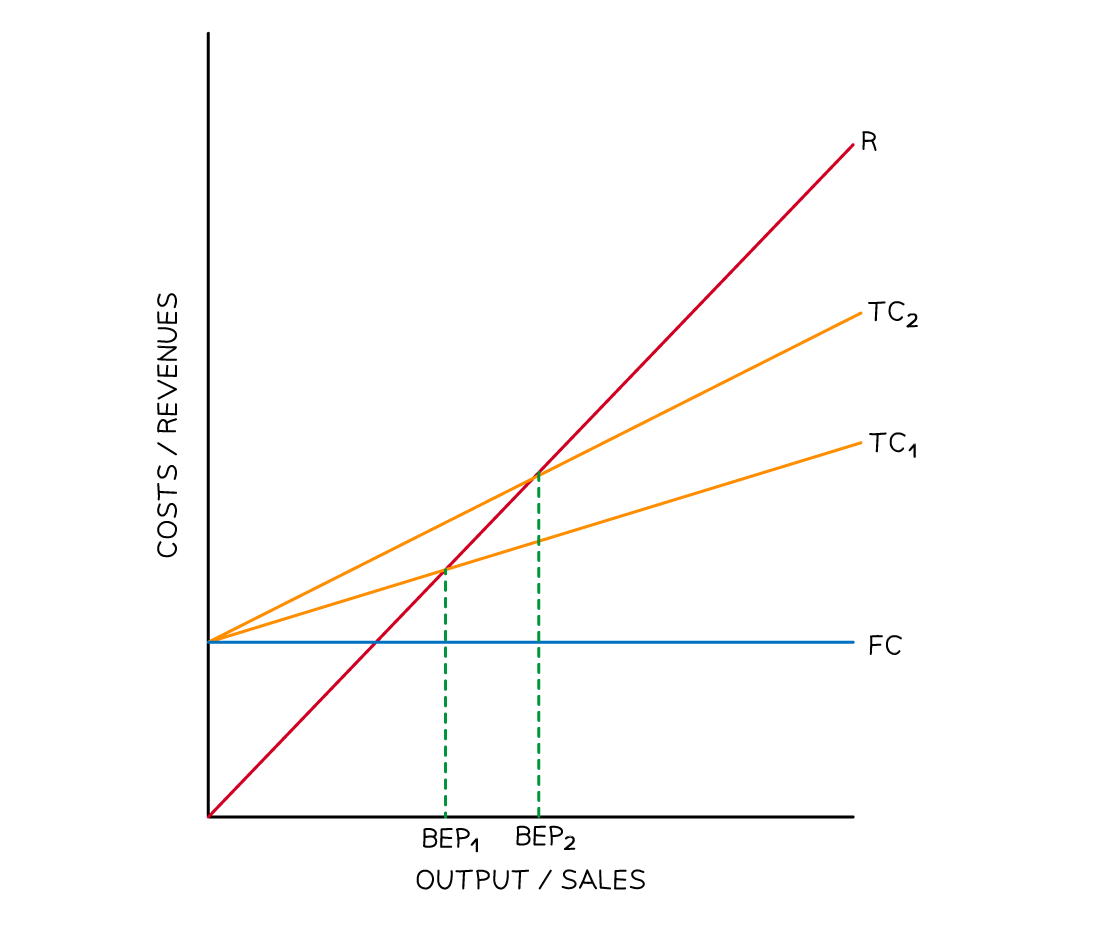 - An increase in variable costs increases total costs at each level of output, from TC1 to TC2 - The break-even point increases from BEP1 to BEP2 - Profit on each unit of output greater than the break-even point is decreased | - A decrease in variable costs decreases the break-even point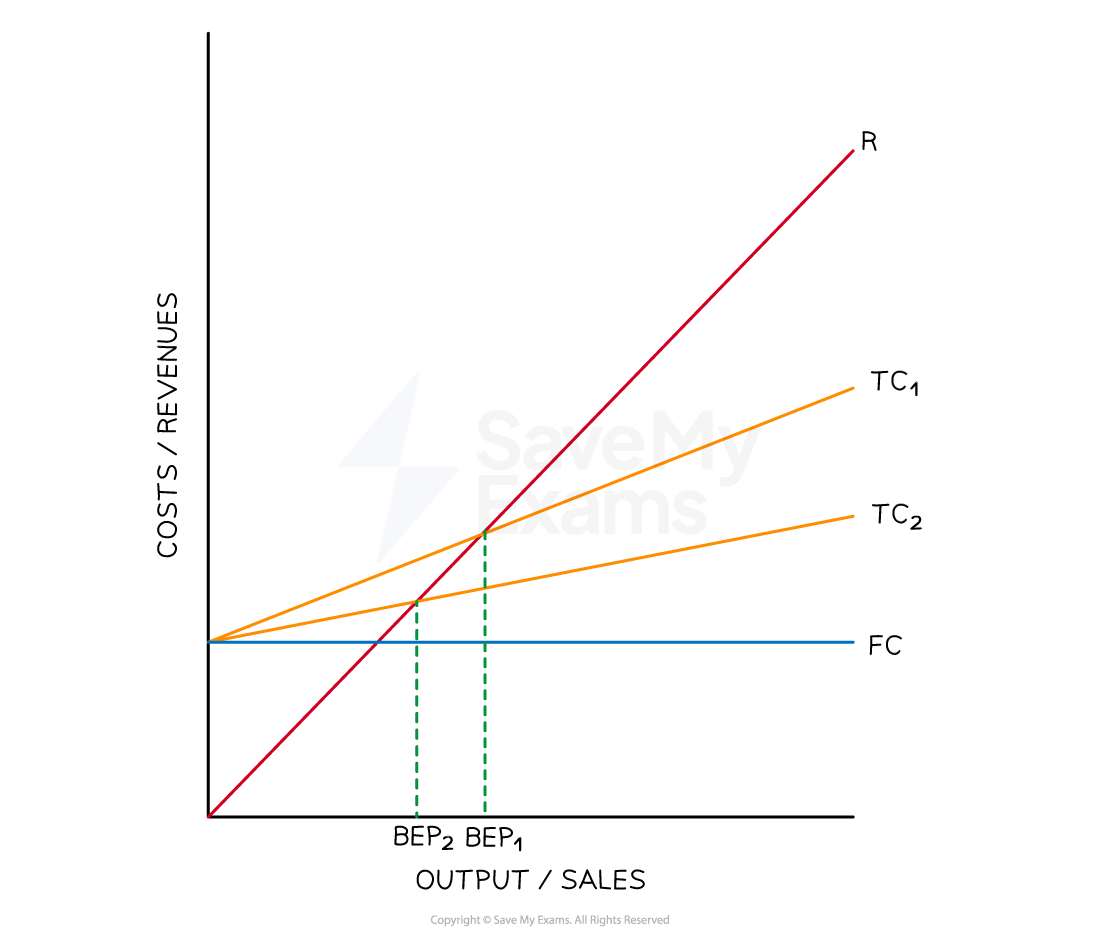 - A decrease in variable costs decreases total costs at each level of output, from TC1 to TC2 - The break-even point falls from BEP1 to BEP2 - Profit on each unit of output greater than the break-even point is increased |
| Increased fixed costs | Decreased fixed costs |
- An increase in fixed costs increases the break-even point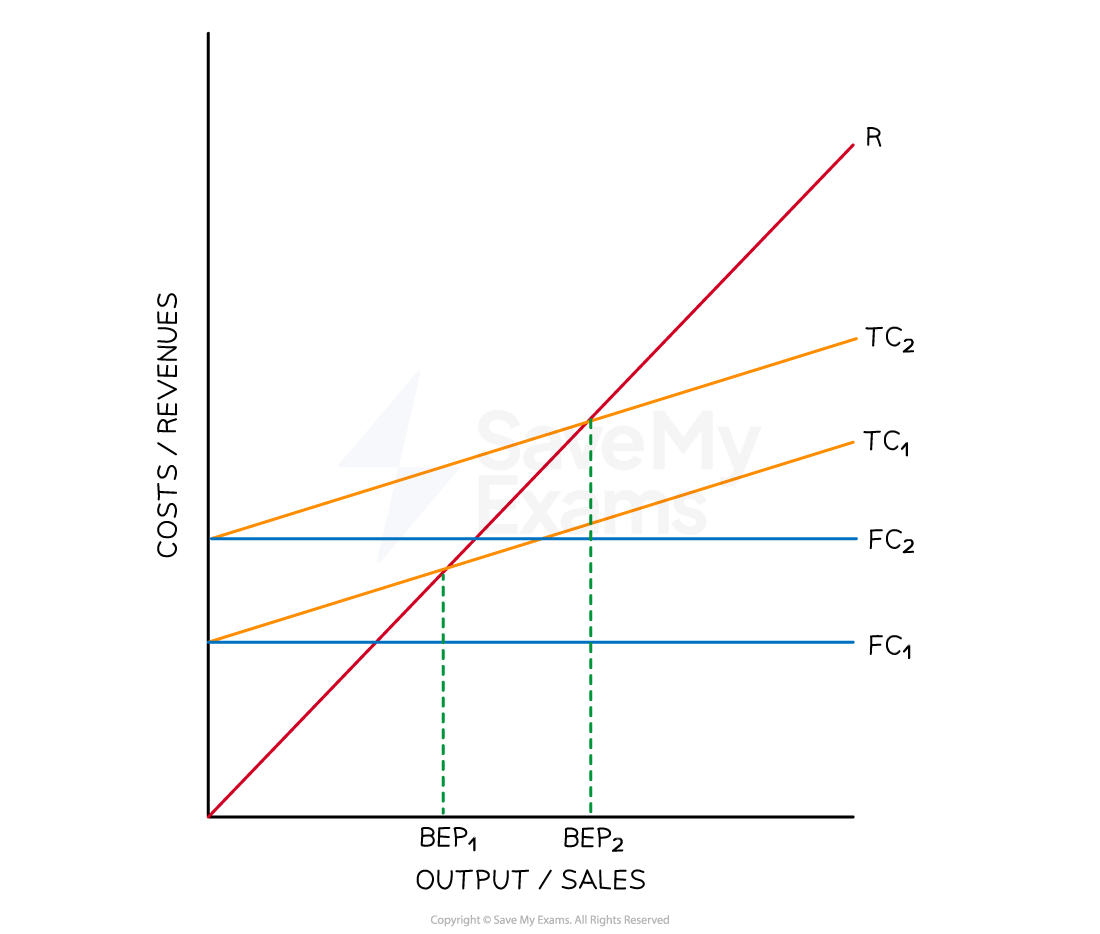 - An increase in fixed costs increases total costs at each level of output, from TC1 to TC2 - The break-even point increases from BEP1 to BEP2 - Profit on each unit of output greater than the break-even point is decreased | - A decrease in fixed costs decreases the break-even point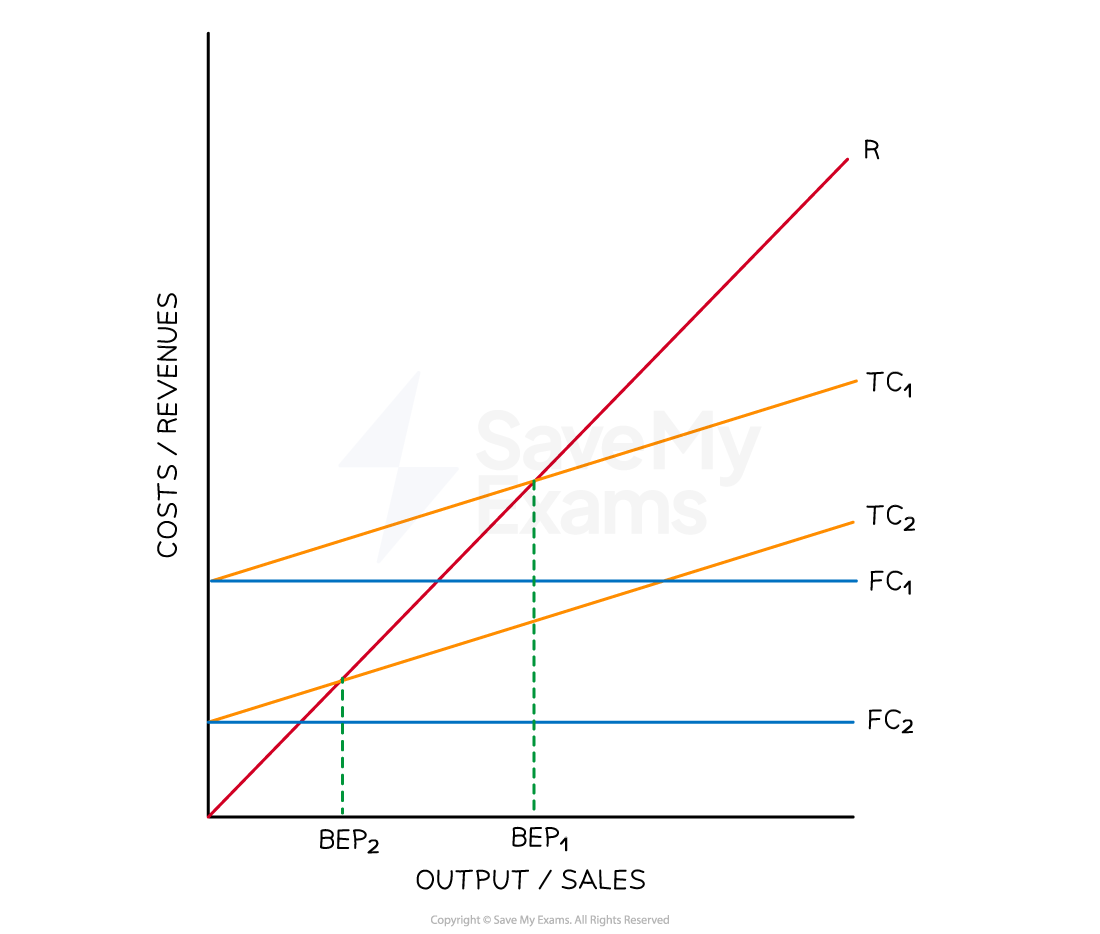 - A decrease in fixed costs reduces total costs at each level of output, from TC1 to TC2 - The break-even point falls from BEP1 to BEP2 - Profit on each unit of output greater than the break-even point is increased |
Limitations of break-even charts
Spec point —
3.3.3· Interpretation of break-even charts: • limitations of break-even charts.
Limitations of break-even charts
- Whilst they provide an accessible way to understand costs, revenues and break-even there are some limitations of using break-even charts to support decision making
1. Costs do not always increase in direct proportion to units sold
- Businesses may be able to negotiate bulk-buying discounts that reduce variable costs per unit at high levels of output
- Fixed costs could increase significantly at higher levels of output as more staff or equipment may be required
2. Revenue does not always increase in direct proportion to units sold
- Buyers may demand discounts for placing large orders, which will reduce the selling price per unit
3. Cost data is often estimated
- If break-even charts are used for forecasting, future cost estimates are used
- The reliability of these estimates depends on the skills and experience of buyers and financial planners
4. Some output may remain unsold
- The model assumes that all units produced are sold
- In reality, businesses keep some stock as a buffer to meet demand at a later date
- Unsold stock may be sold at a lower price to reduce storage costs or raise cash
Was this revision note helpful?
Build on this topic