11 markmedium
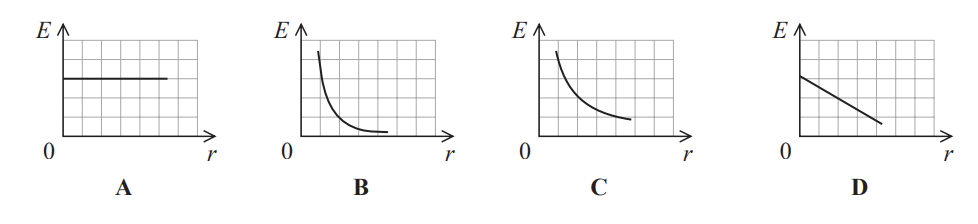
Which of the following graphs shows how the electric field strength E varies with distance r from a positive point charge?
Choose your answer
4 questions · 4 marks · ≈ 4 min
Which of the following graphs shows how the electric field strength E varies with distance r from a positive point charge?
Choose your answer
The electric potential V varies with the distance r from a charged object as shown.

At which distance, A, B, C or D, does the electric field strength have its maximum value?
Choose your answer
The diagram shows two metal plates with a potential difference V across them.
The path of an electron travelling between the plates is shown.

The electron is deviated through an angle θ.
Which row of the table shows changes that will cause θ to decrease?
| V | Distance between plates | |
|---|---|---|
| A | doubled | halved |
| B | doubled | unchanged |
| C | halved | doubled |
| D | unchanged | halved |
Choose your answer
The diagram shows an oil droplet of mass between two parallel metal plates separated by a distance . The upper plate is at potential and the lower plate is at potential . The droplet is stationary.

What is the magnitude of the charge on the droplet?
Choose your answer