Speed vs velocity
Excerpt: This resource asks students to sketch velocity-time graphs from displacement graphs, as well as vice versa, to develop an understanding of gradient functions and what the area under a curve can represent.
Problem
In Discussing distance we mentioned speed and velocity. Average speed is the rate your distance changes in a set period of time, for example in hour. If you walk to school you will speed up, slow down, perhaps even stop. Your speed will not stay the same, but we can talk about your average speed for the trip.
Velocity is similar but, like displacement, also depends on direction. If you average on your walk to school, and walk home in the same amount of time, your velocity for the return part of your journey would be .
Both displacement and velocity involve two pieces of information. How far (or fast) you travel, and the direction. Quantities like this are known as vectors.
-
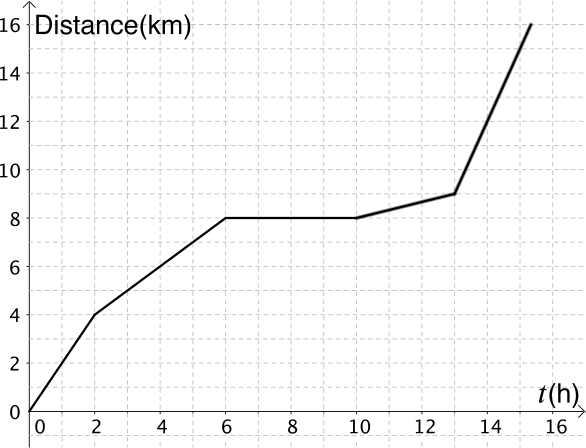
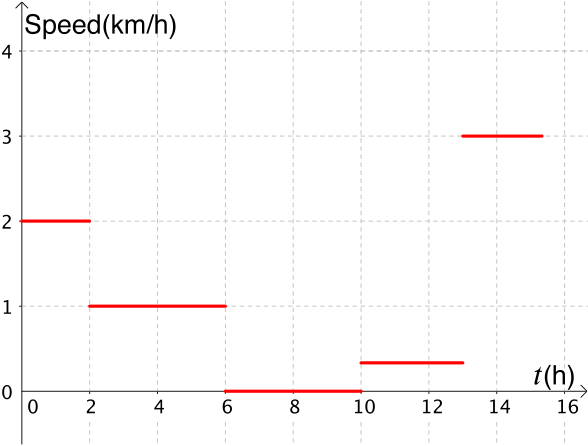
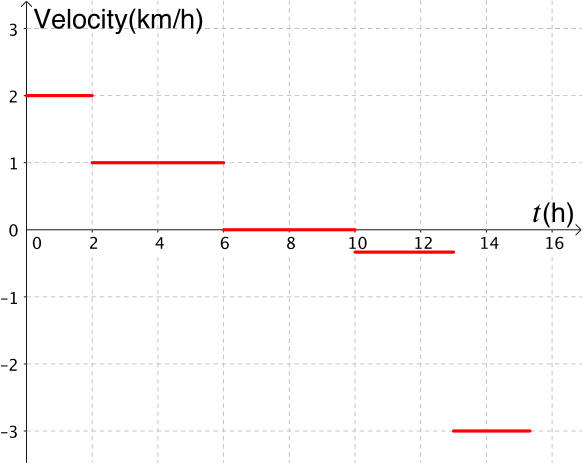
Try to sketch the speed-time graph and the velocity-time graph from these distance and displacement graphs of the same journey. Think about how you will work out the speeds and velocities. Will you use a formula? Or can you use features from the graphs?
-
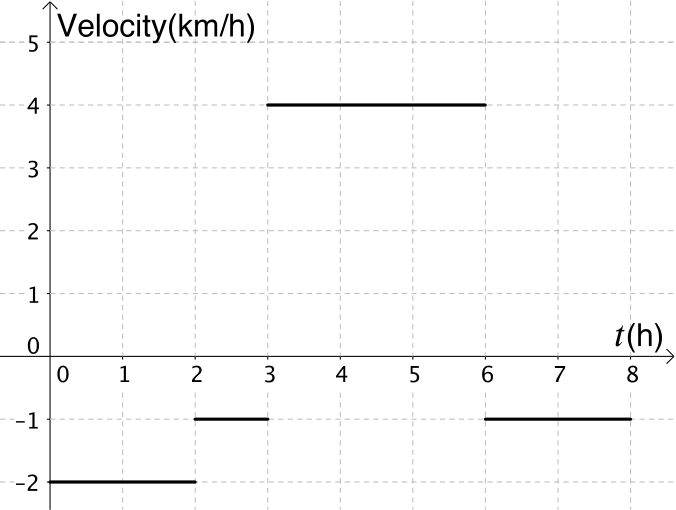
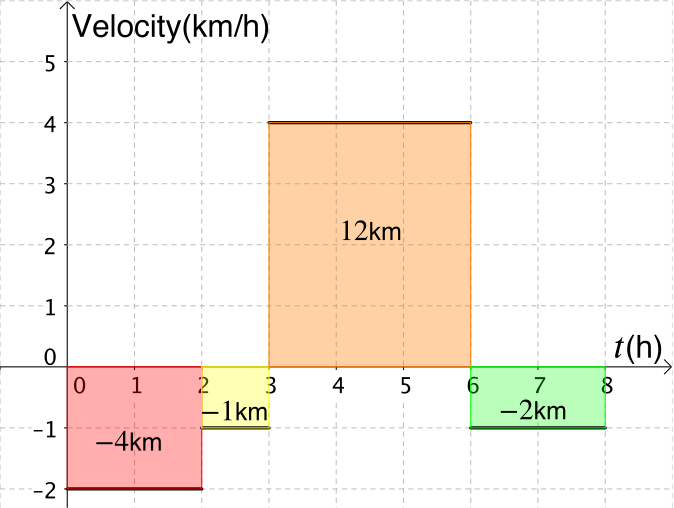
Given this velocity-time graph below, can you sketch the displacement-time graph?
Suggestion
From the velocity-time graph, we can determine which direction is positive and which direction is negative. On the first section of this journey we are moving away from the starting point at in the negative direction.

Solutions
- Try to sketch the speed-time graph and the velocity-time graph from our distance and displacement graphs of the same journey. Think about how you will work out the speeds and velocities. Will you use a formula? Or can you use features from the graphs?
The formula we could use is Given that the axes are distance and time, this is also a formula for the gradient. Therefore the speed and velocity can be found by looking at the gradient of each section of the graph.
Distance and speed
Remember, displacement is the distance away from your initial point of measurement. The journey these graphs are based on, from Discussing distance was along a straight road. If the road curved instead, would you get the same graphs for distance and displacement?
Displacement and velocity
Both our graphs for speed and velocity look quite unusual. Here are some more things to think about before you move on.
-
Do you think these graphs could come from a journey in the real world?
-
Why are the separate pieces of the graphs not joined up?
-
Given the velocity-time graph below, can you sketch the displacement-time graph?
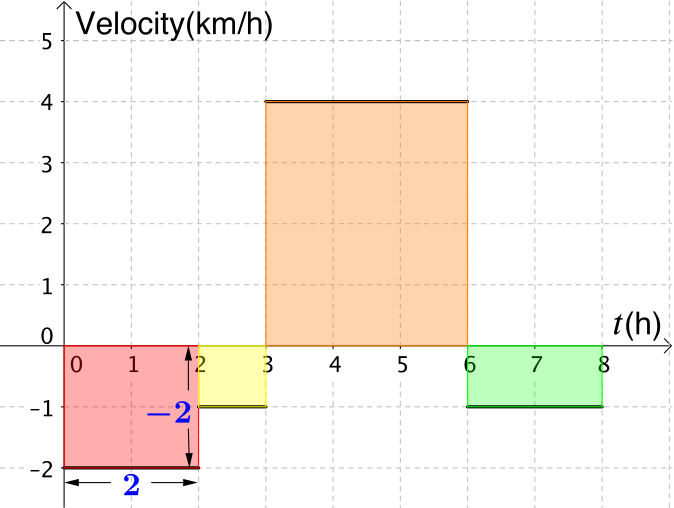
If we look at the first section on the graph, we know the velocity is for hours.
As , the displacement will be .
Let’s think about what this answer means. is travelled during the first hours. For example, if we are walking along a straight road and we measure positive displacement in one direction, then has been travelled in the opposite direction.
We can work out the displacement for each of the sections on the graph. What is the link between the displacement and the rectangles drawn for each section of the graph?
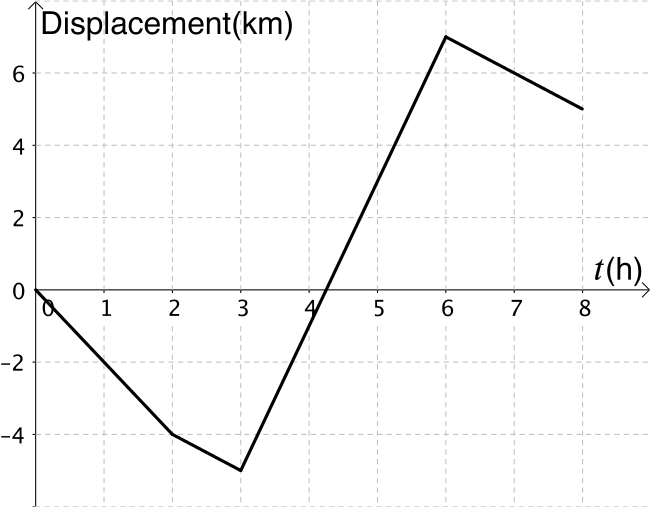
Now we need to put this information on to a displacement-time graph. Does this match what you have drawn?
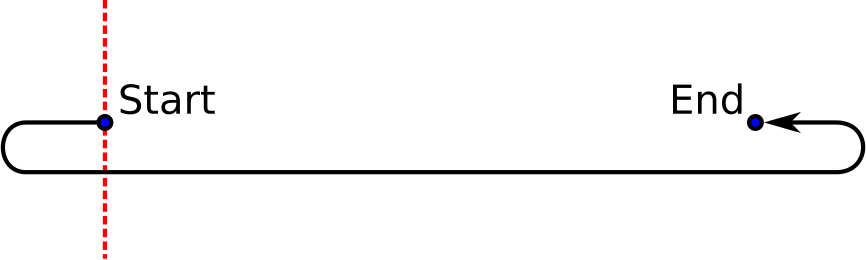
This graph represents our journey when we are measuring displacement from our starting point which could be the dotted line in the diagram below.
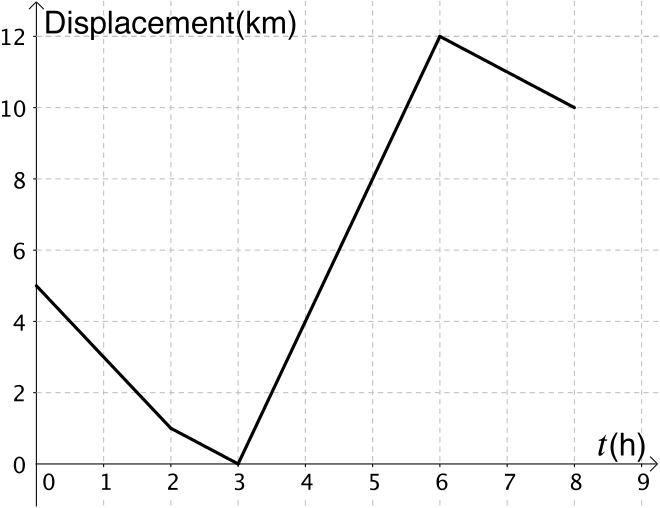
However, we don’t actually know where the displacement was measured from. If the same journey had its displacement measured from where the dotted line is now, what would the graph look like?
Graph
It is likely that most people would have drawn the first graph, but either of these graphs could be correct for the information we had.
-
Can you describe the differences between the graphs using mathematical language?
-
Could you draw another graph that represents the velocity-time graph we started with? Where did you measure the displacement from?
-
What is the total distance that has been travelled for this journey?
All the journeys that have been explored here involved moving at constant speeds or velocities for intervals of time. For example, we could say that after hours they were travelling at . This is not an average speed but their actual speed.
In reality, we rarely travel at a constant speed and it is very difficult to measure actual or instantaneous speed. One of the best things we can do is to take average speed over small intervals of time. For very small time intervals, approaching zero, we can think about the idea of instantaneous speed.

Thinking about journeys
The journey described by our velocity-time graph was along a straight road.
For each of the situations below, can you sketch a speed-time graph and a velocity-time graph?
-
Do the graphs look the same?
-
Are they both possible to draw?
Situation one
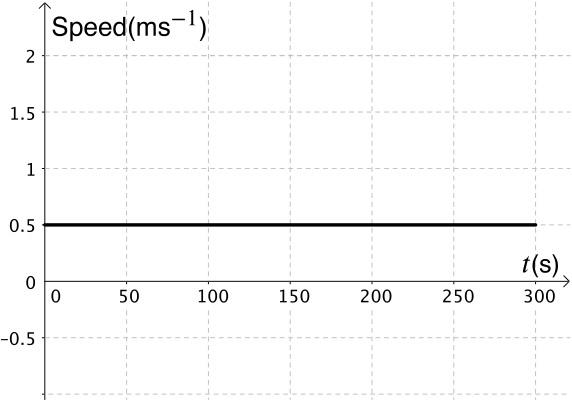
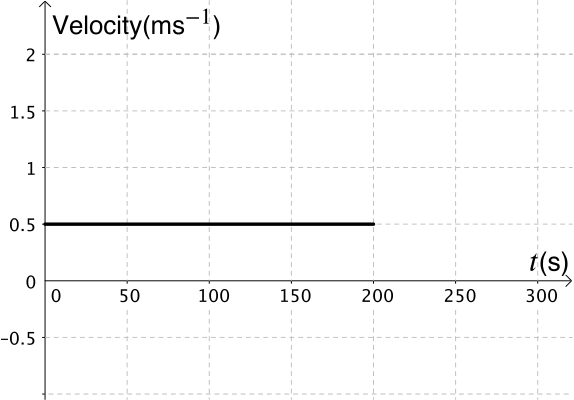
You walk straight to school travelling at a constant speed of .
Discussion points
The graphs look identical here as we have measured our positive velocity in the direction of ‘home to school’. How would the graphs differ if we measured positive velocity in the opposite direction?
How many dimensions is our journey taking place in?
Situation two
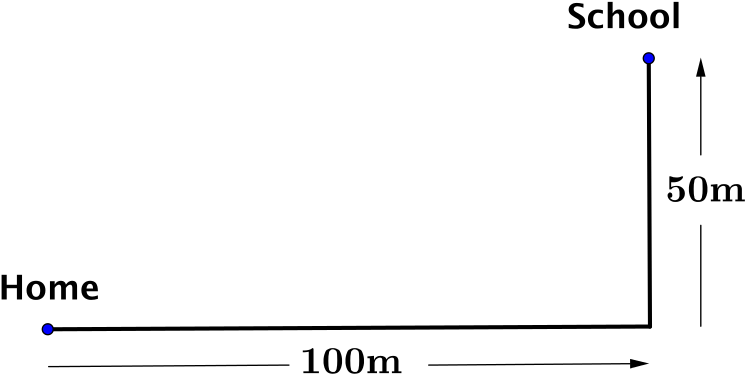
You walk straight along the road from home to school and at the end of the first road you take a turn left. You travel at a constant speed of .
At faster speeds we would expect to slow down when we approach and turn a corner. Here we are making the assumption that the constant speed of is maintained.
Discussion points
While the speed-time graph is easy to draw, the velocity-time graph should have made you stop and think. What happens when you turn the corner?
In what direction are we measuring velocity?
Can you graph anything for ? Is it meaningful?
We have seen that journeys in one dimension can easily be represented on displacement-time and velocity-time graphs. However it is not possible to represent journeys in two dimensions in the same way. In order to work with journeys in two (or more) dimensions we use vectors.