Gantt (Cascade) Charts (Edexcel IAL Maths)
Gantt Charts
Spec point —
4.4
What is a Gantt (cascade) chart?
-
A Gantt chart is a graphical display of the activities making up a project
-
A Gantt chart shows
- the critical activities
- the total float for non-critical activities
- the minimum project duration
-
-
Gantt charts can be used in scheduling problems
- A Gantt chart assumes one worker per activity
-
A Gantt chart is also known as a cascade chart
How do I draw a Gantt (cascade) chart?
-
A horizontal axis is drawn for time
-
Activities are then drawn as a series of bars (rectangles) underneath
-
Each activity is assumed to commence at its earliest event time
- The earliest start time is the early event time of its start node
-
Each activity is assumed to occur in a single block of time
- There are no breaks in an activity
- E.g. an activity of duration 5 and early event time 4 would be drawn as a bar starting at 4 and ending at 9
-
-
Critical activities are all drawn in the same horizontal line
- These have a total float of **zero **so are drawn back-to-back
-
Each** non-critical activities** is drawn on a separate line
-
Their total float is indicated by a bar drawn with a dotted line
- The dotted float bar can be seen as the room that the activity bar can slide back and forth along
-
The start and end times of a non-critical activity are flexible
-
E.g. An activity of duration 4, early event time 7 and total float 3 would be drawn as
- a (solid) bar starting at 4 and ending at 11 with a dotted bar starting at 11 and ending at 14
-
-
Bars are labelled with their activity name and duration
- Floats are not labelled
-
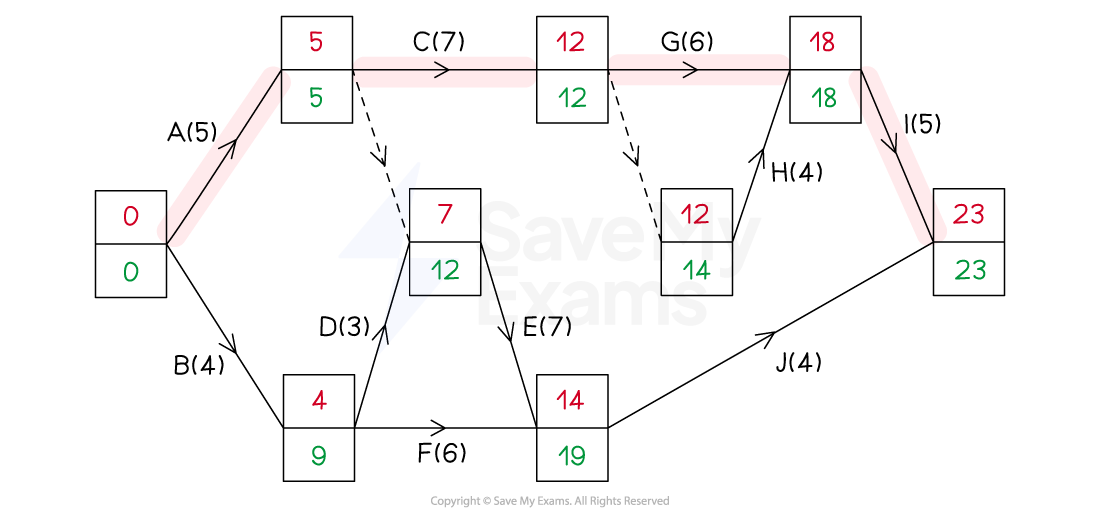
For the activity network below
-
The critical activities are highlighted and are A, C, G and I
- The critical path is A-C-G-I
-
The minimum project duration is 23 (days)
-
-
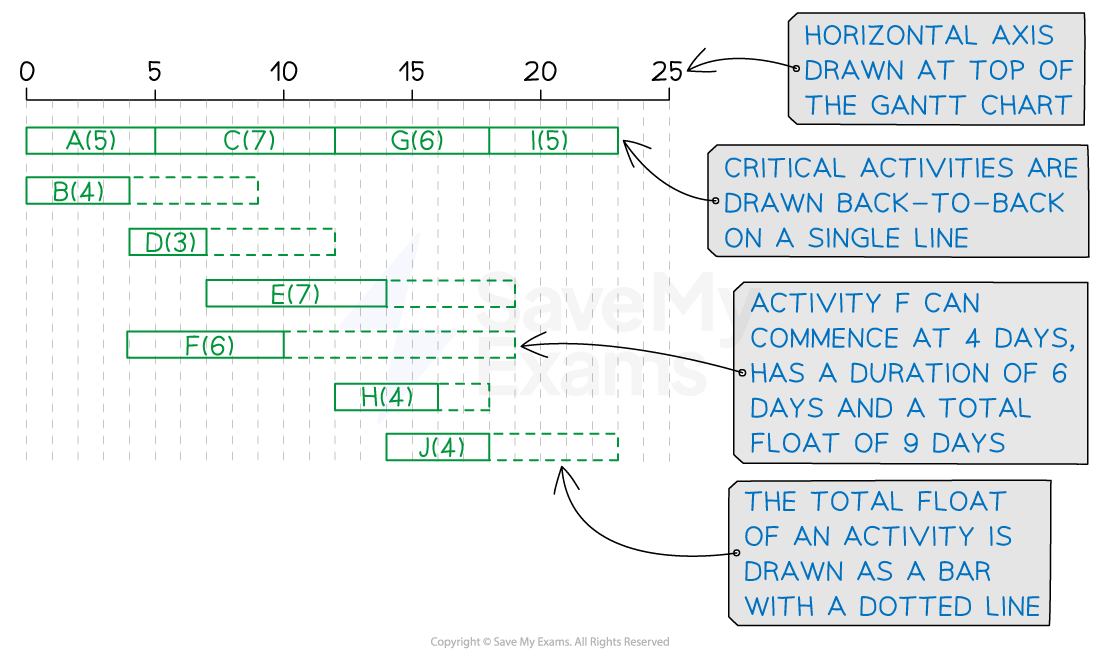
The Gantt chart for the project would be constructed with the following
-
A horizontal axis running from 0 to (at least) 23
- 0 to 25 keeps things nice!
-
Critical activities A, C, G and I drawn back-to-back on a single line underneath
-
Activities B, D, E, F, H and J each drawn on a separate line
- E.g. Activity D will be drawn as a solid bar from 4 to 7 with a dotted bar from 7 to 12
-
Exam Hint
- An exam question is likely to provide a grid and the axes for you to draw a Gantt chart on
Was this revision note helpful?
Build on this topic