Sketching the Feasible Region (Edexcel IAL Maths)
Introduction to Solving an LP Problem Graphically
Spec point —
5.2
How do I solve a linear programming problem graphically?
-
For problems with two decision variables
- Plot the constraints (inequalities) accurately on a graph
- This leads to the feasible region
- The optimal solution will be one of the vertices of the feasible region
-
In harder problems
-
There may be a third decision variable
- There will be a connection to one (or both) of the other decision variables
- All constraints can be rewritten in terms of just two of the decision variables
- E.g. are the numbers of chairs, tables and desks made by a furniture manufacturer The number of desks produced is twice the number of tables, i.e.
-
The optimal solution may not give integer values for the decision variables but the context demands they are
- E.g. Is it possible to make 3.65 chairs and 4.2 tables per day?
-
Feasible Region
Spec point —
5.2
What is the feasible region?
-
The feasible region is the set of all values that satisfy all the constraints in a linear programming problem
-
In practice, this is the area on a graph that satisfies all of the inequalities
- This includes the non-negativity inequality
-
How do I find the feasible region?
-
To find the feasible region
-
Accurately plot each inequality (constraint) on a graph
- Plot each inequality as a straight line
- Rearranging to the form or may help
- It can be easier to determine two points that lie on each line, plot and join them up
- Draw the line solid for inequalities involving ≤ or ≥, or dotted for inequalities involving > or <
- < and > are rare in linear programming problems
-
Shade the part of the graph not satisfied by each inequality
- It is easier to see a 'blank' area rather than an area shaded several times
-
The feasible region is the area on the graph left unshaded
- It is the area that satisfies all of the inequalities
- It is usually labelled with the capital letter
-
-
Label the line of each inequality around the edge of the graph
Exam Hint
Exam questions will provide a graph for you to accurately plot the inequalities
- Alternatively they may provide an accurate graph with some or all of the inequalities already plotted
It is helpful to complete the shading for each inequality as you add it to the graph
- If you leave the shading to the end it can become confusing
Worked Example A linear programming problem is formulated as
Maximise
subject to
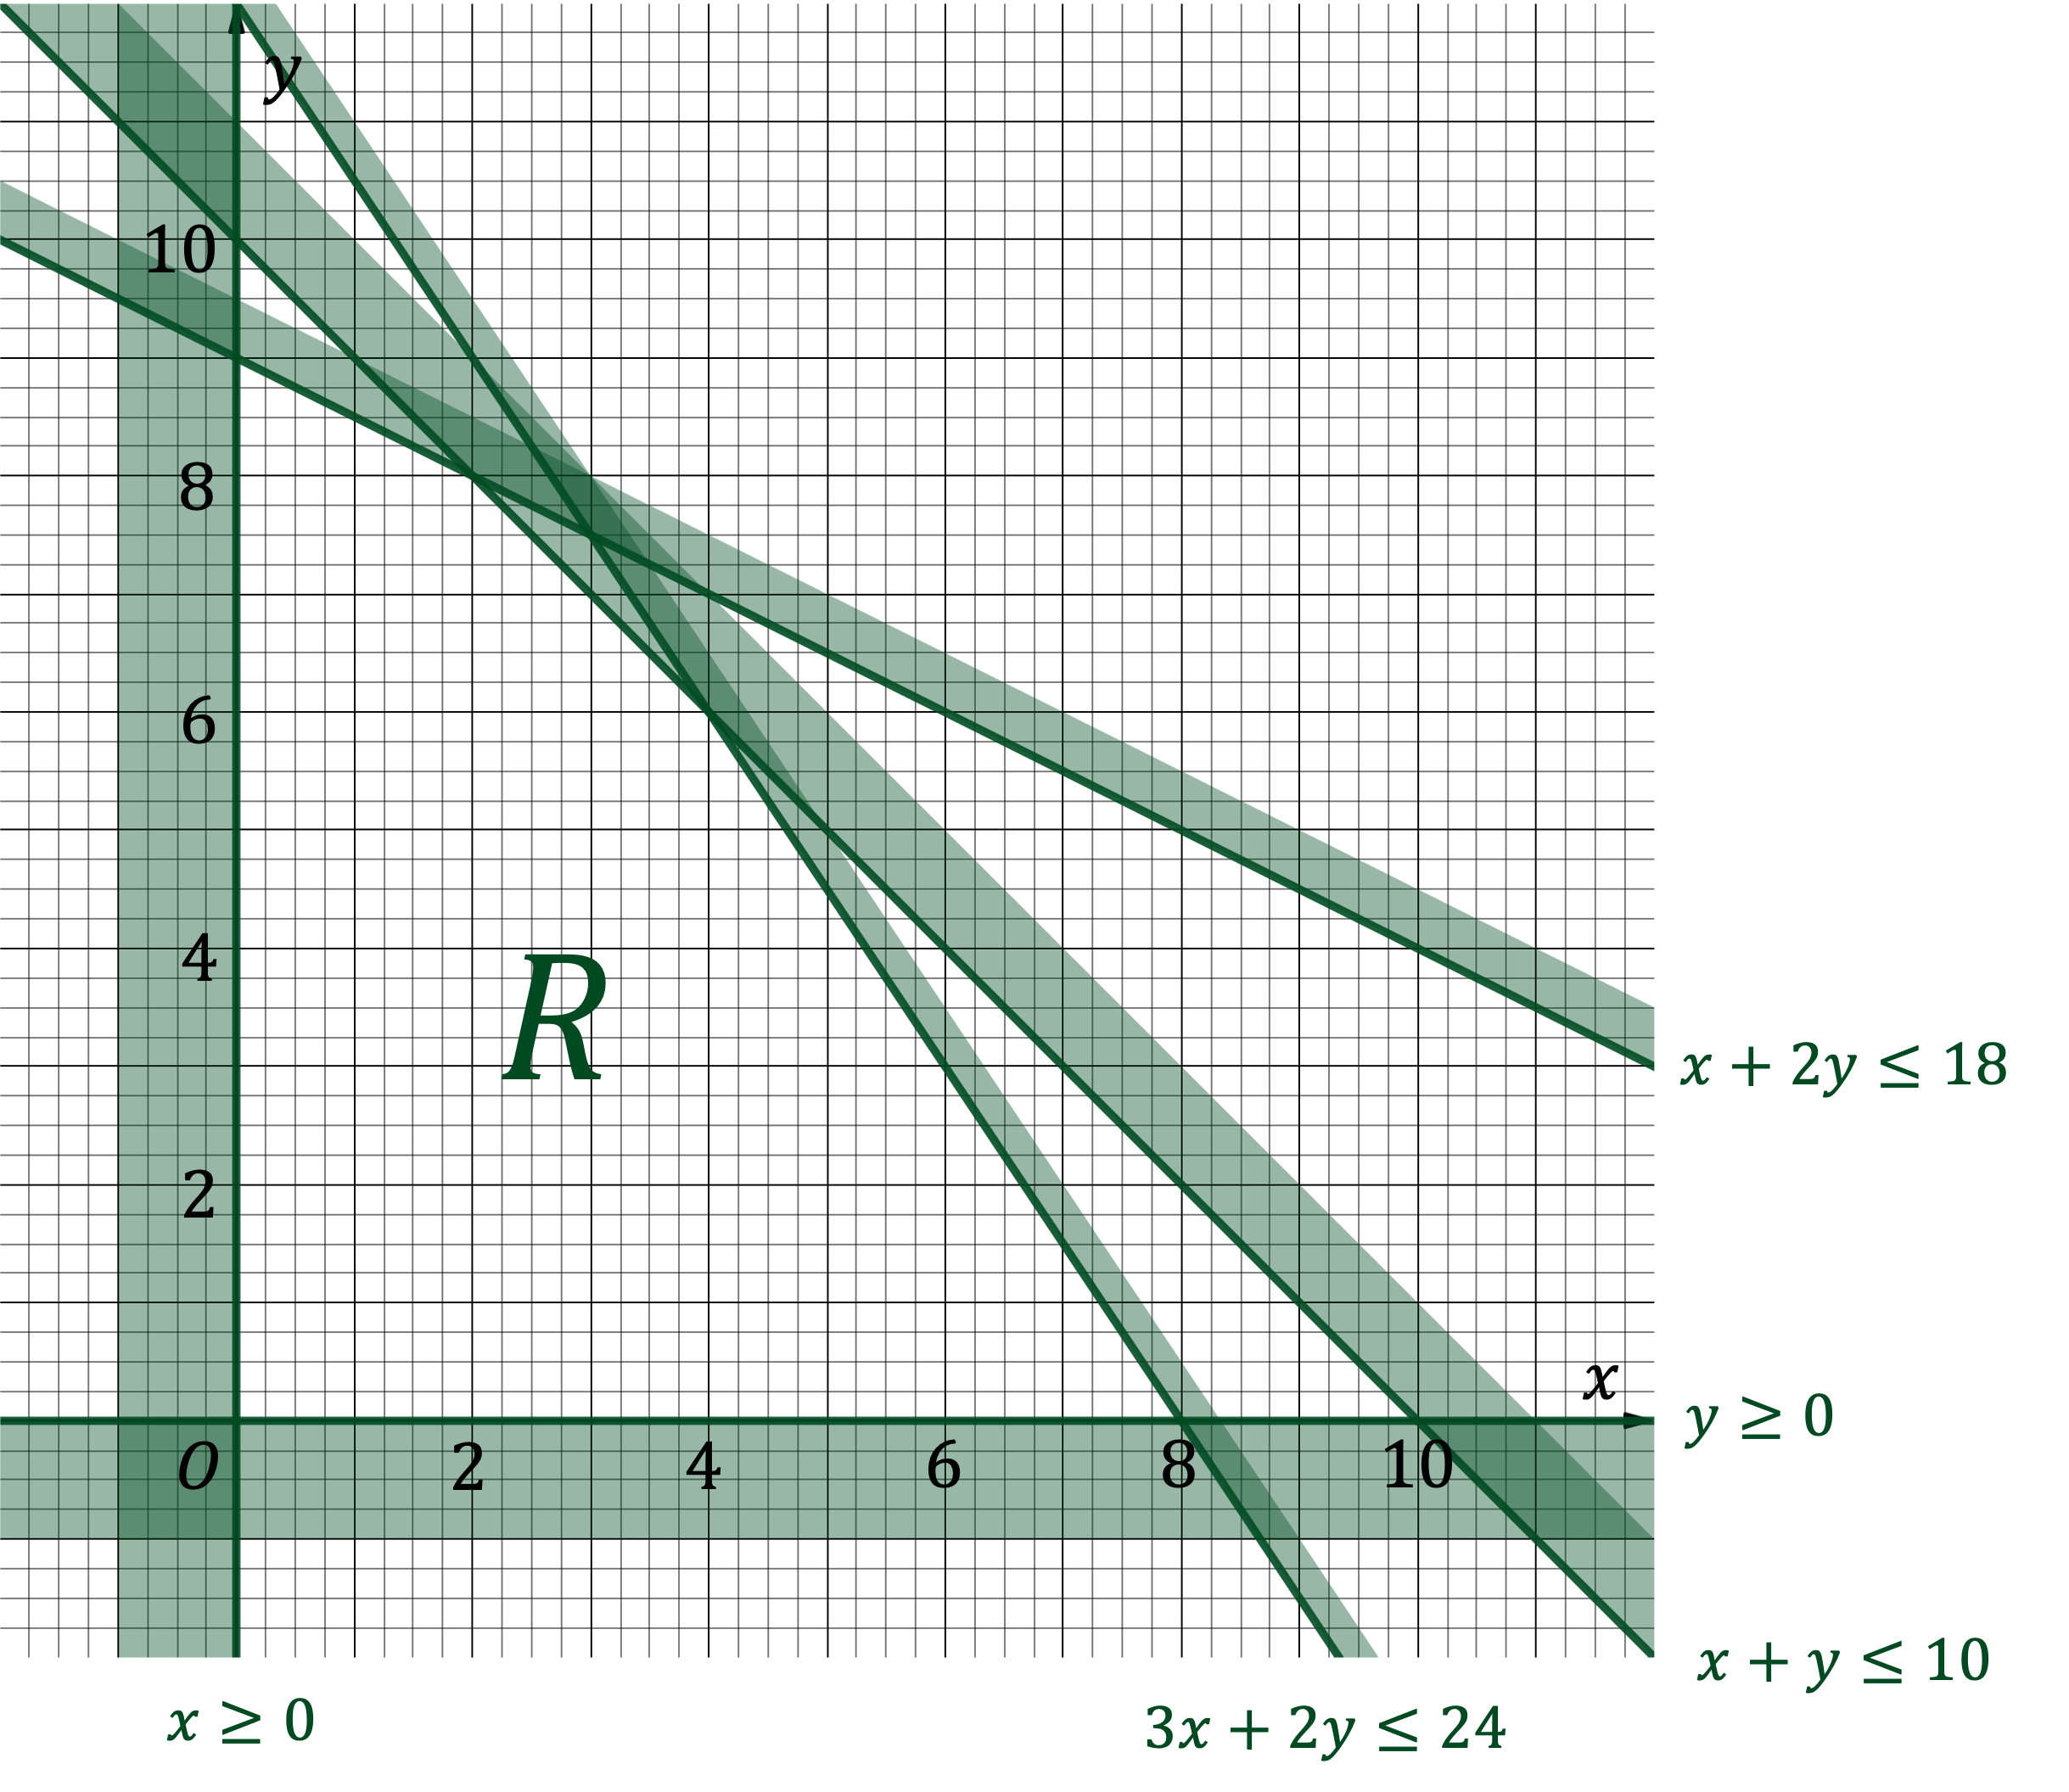
Show graphically the feasible region, , of the linear programming problem.
Answer:
The objective function is not needed to plot the feasible region
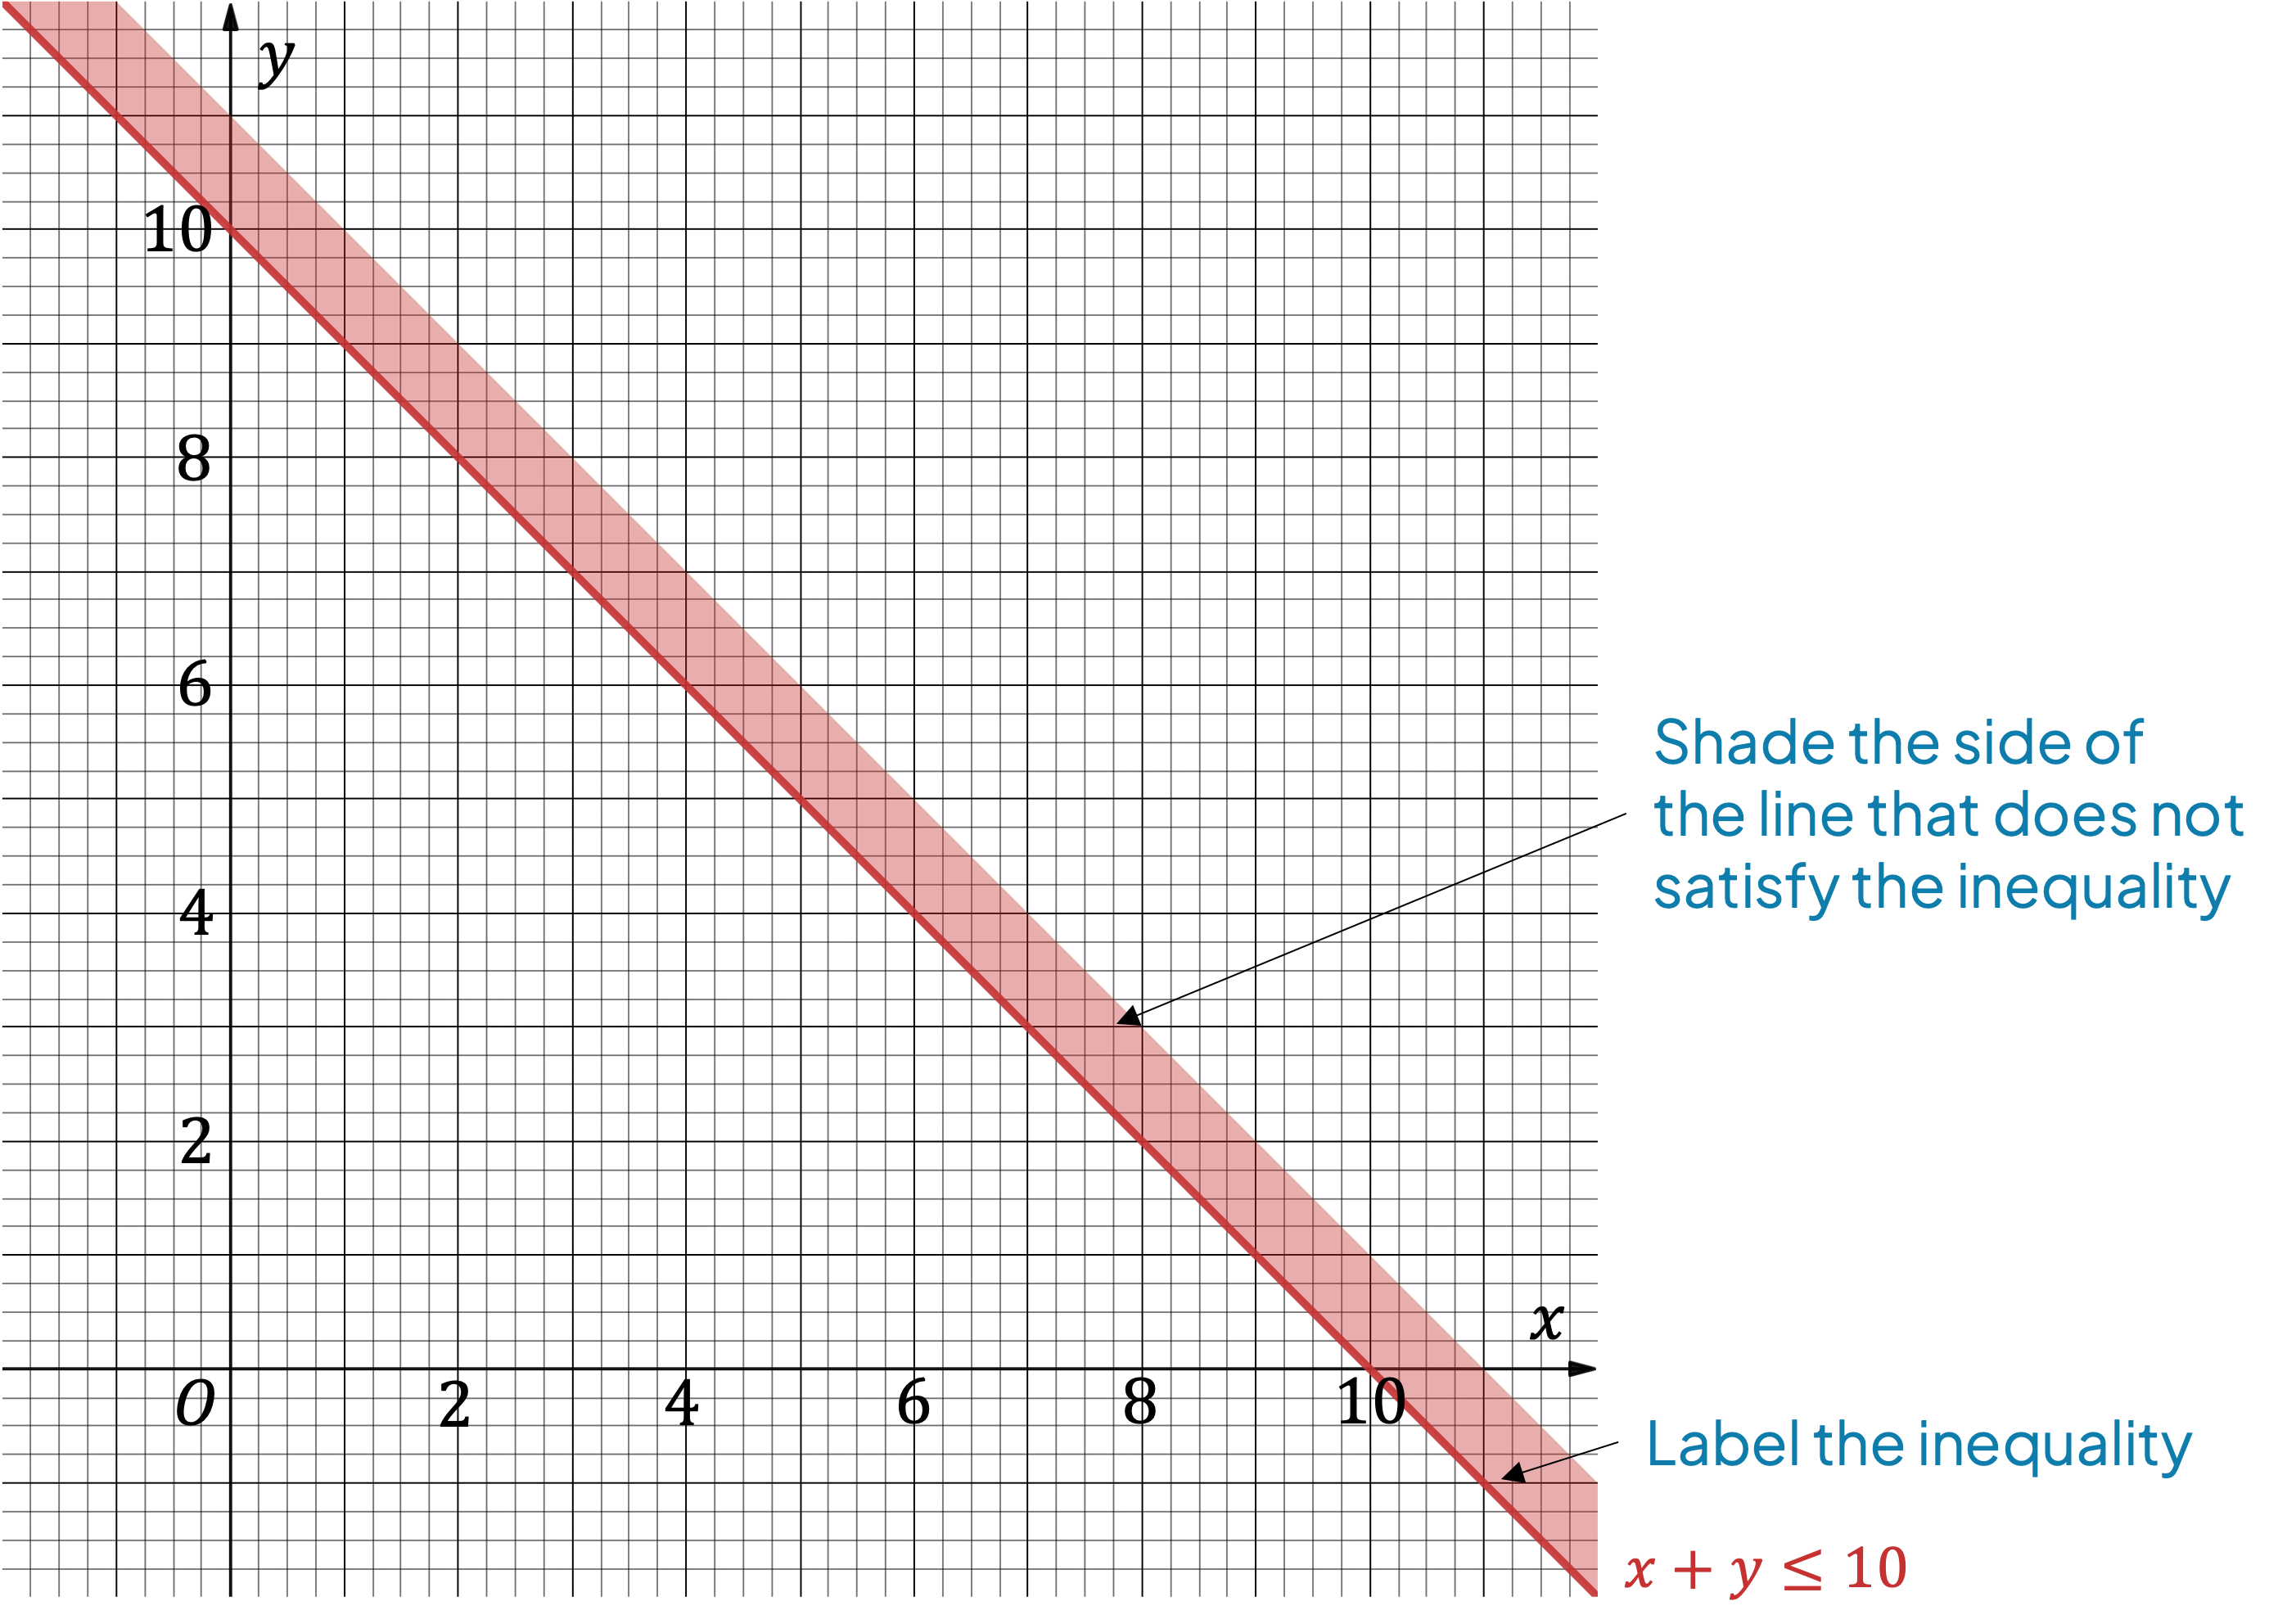
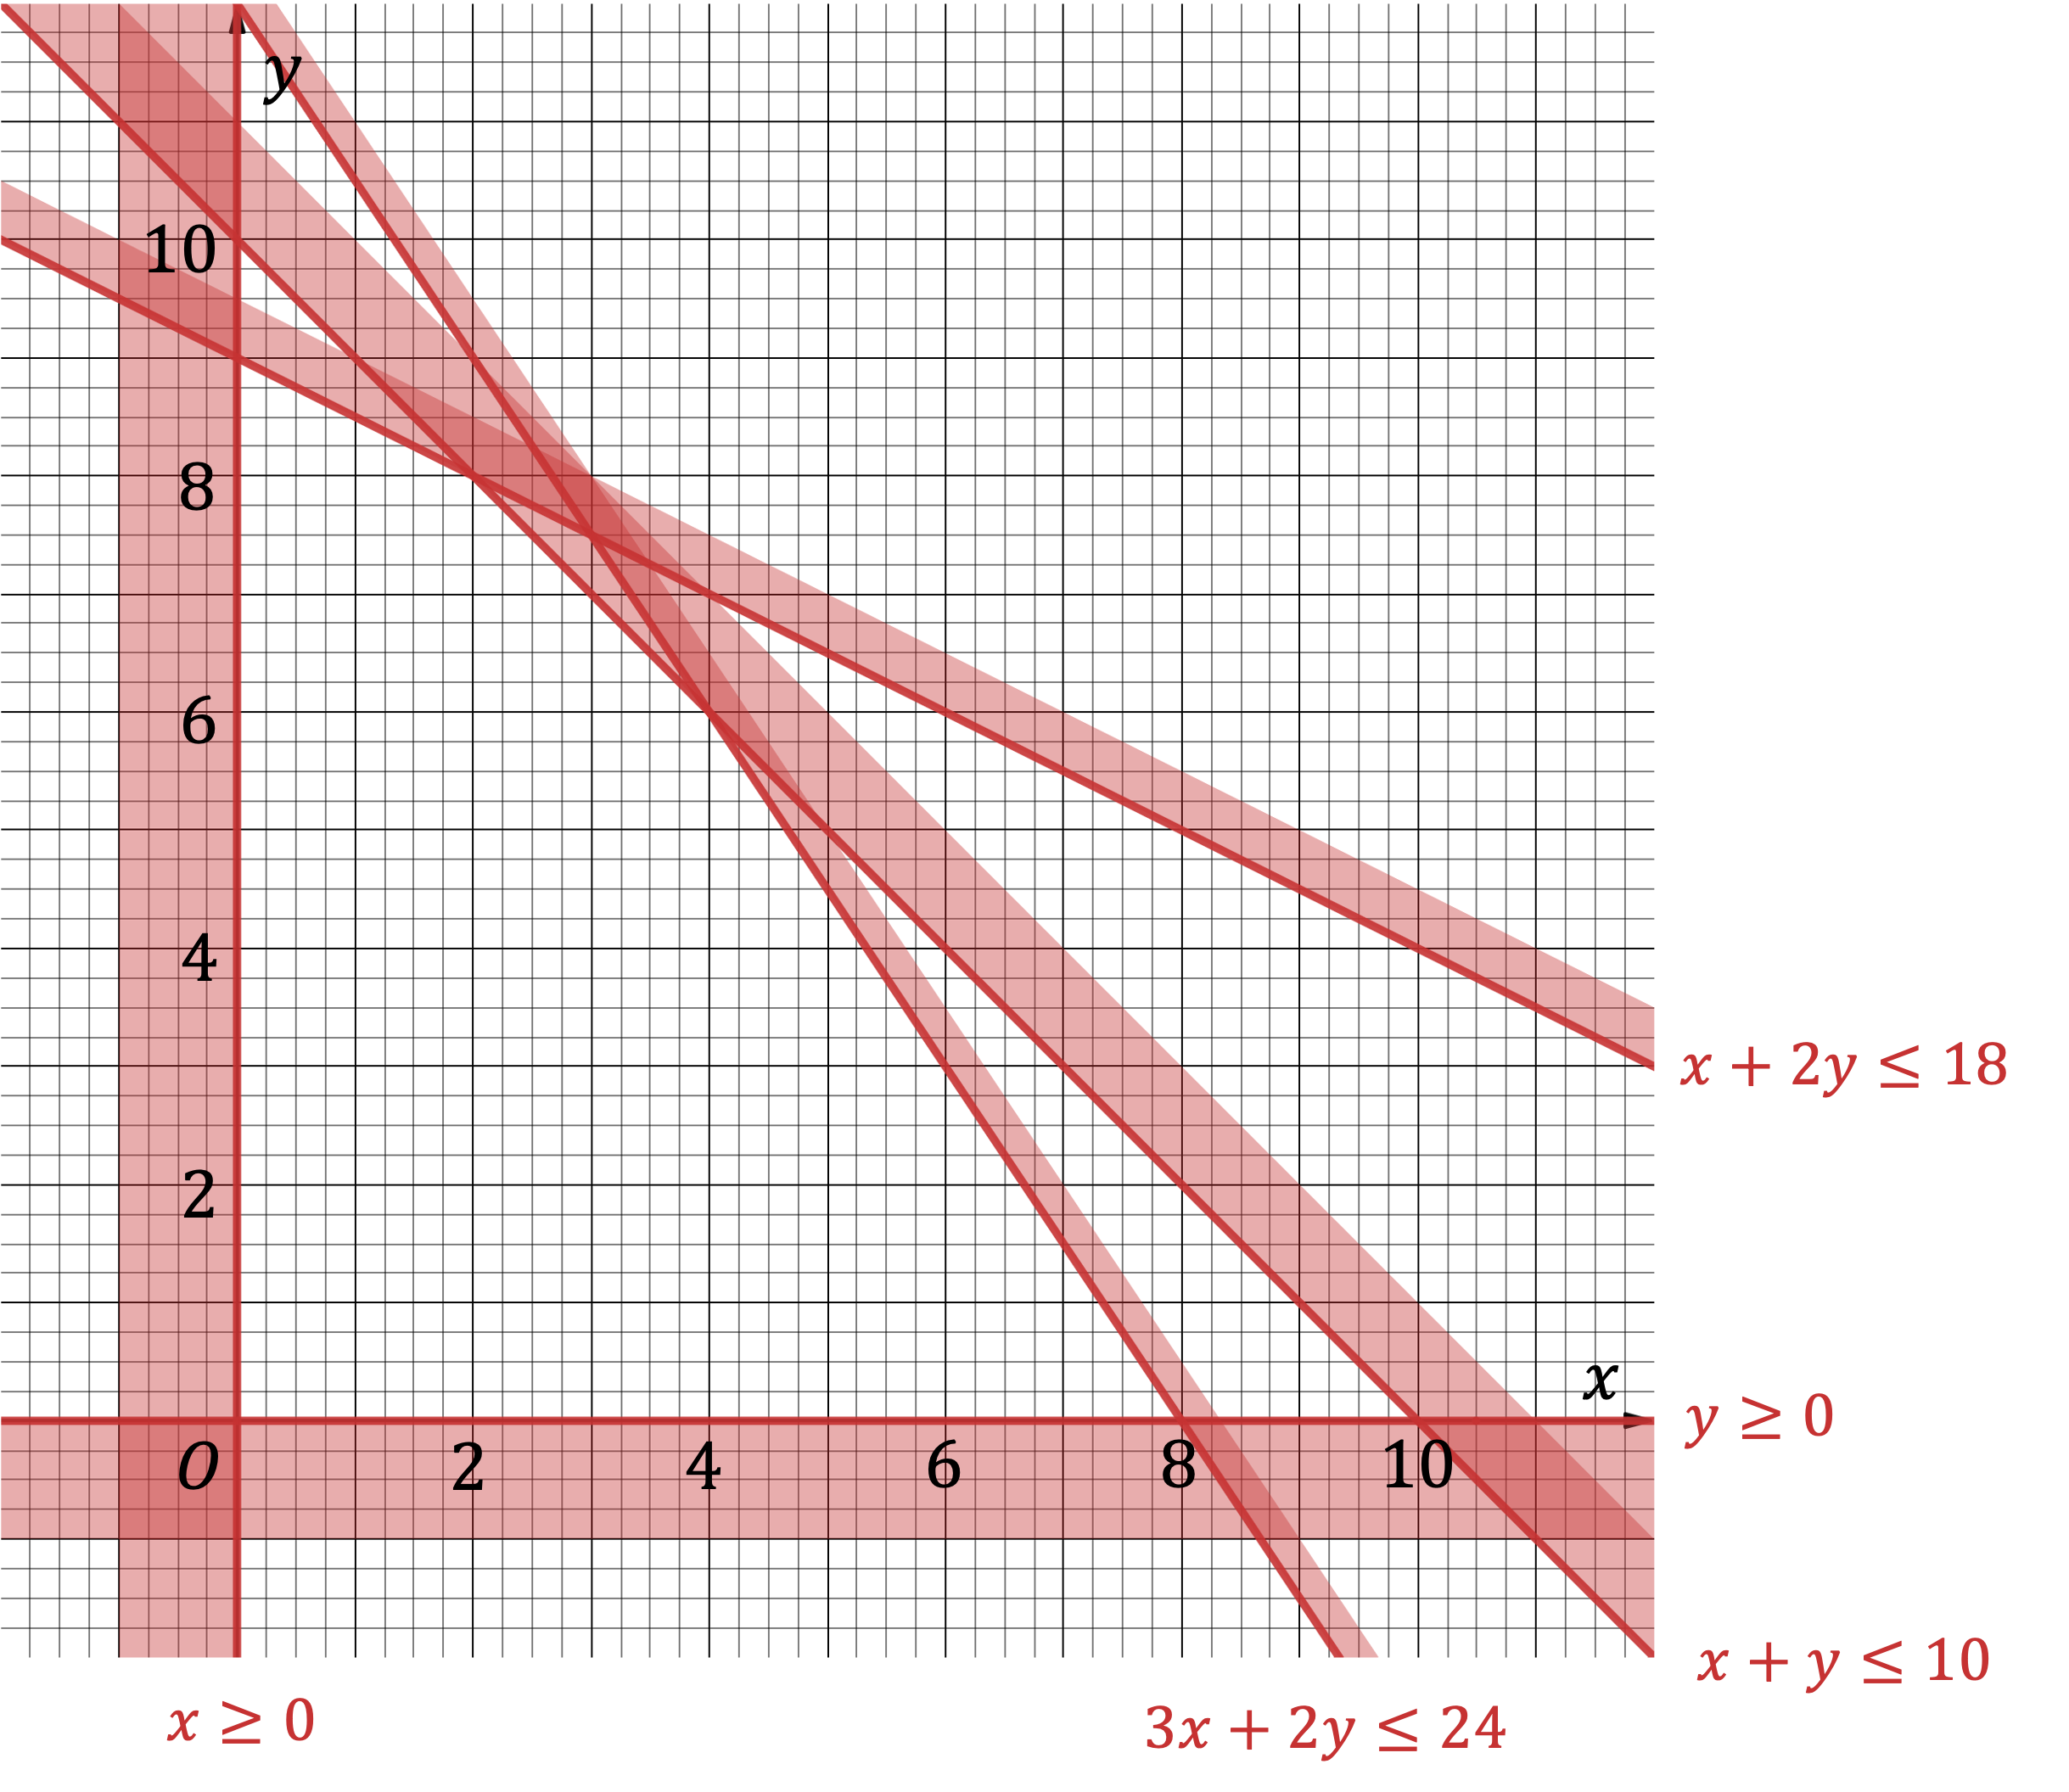
Plot each inequality as a straight line graph with the 'unwanted' side shaded For this problem, all lines will be solid lines The first constraint will be the line (gradient -1 and -axis intercept 10) (You may find it easier to 'see' that points like (0, 10) and (10, 0) lie on the line, which you can plot and join up)
Plot and label the rest of the inequalities in the same way
Label the feasible region with
Was this revision note helpful?
Build on this topic