Exponential Graphs (Cambridge International IGCSE Maths)
Exponential Graphs
What is an exponential graph?
-
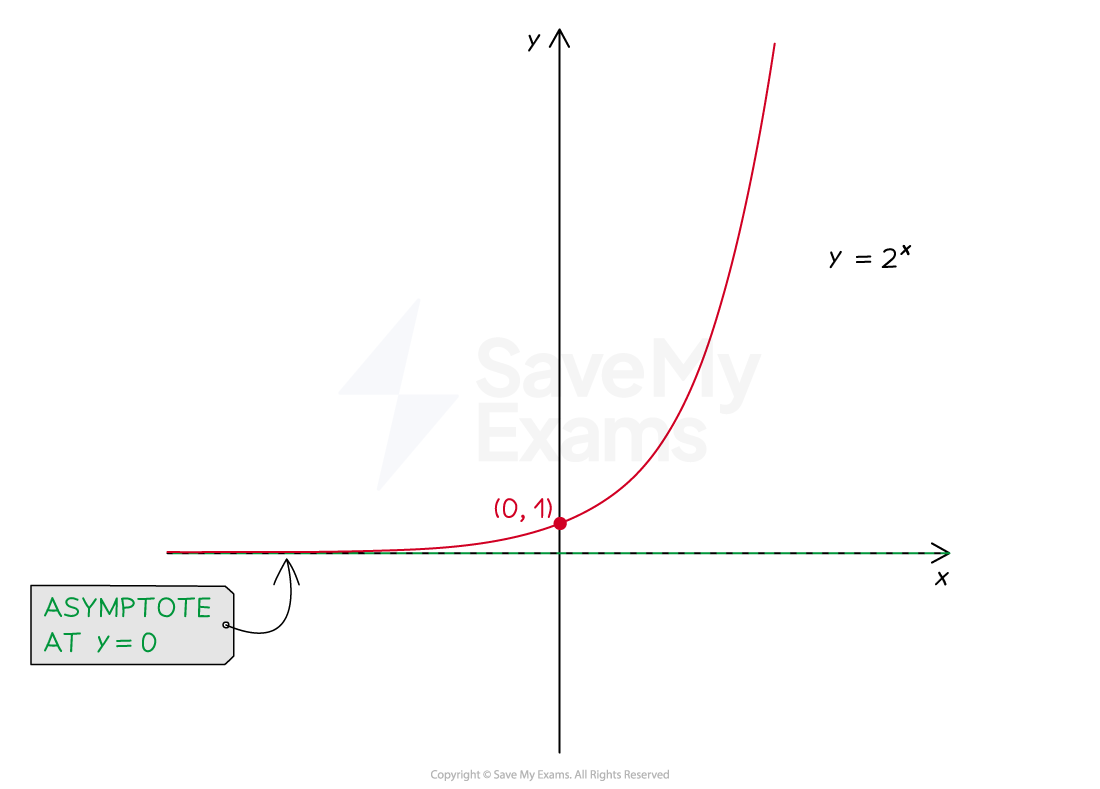
An exponential graph is of the form
-
When , represents exponential growth
- Values of y increase as x increases
-
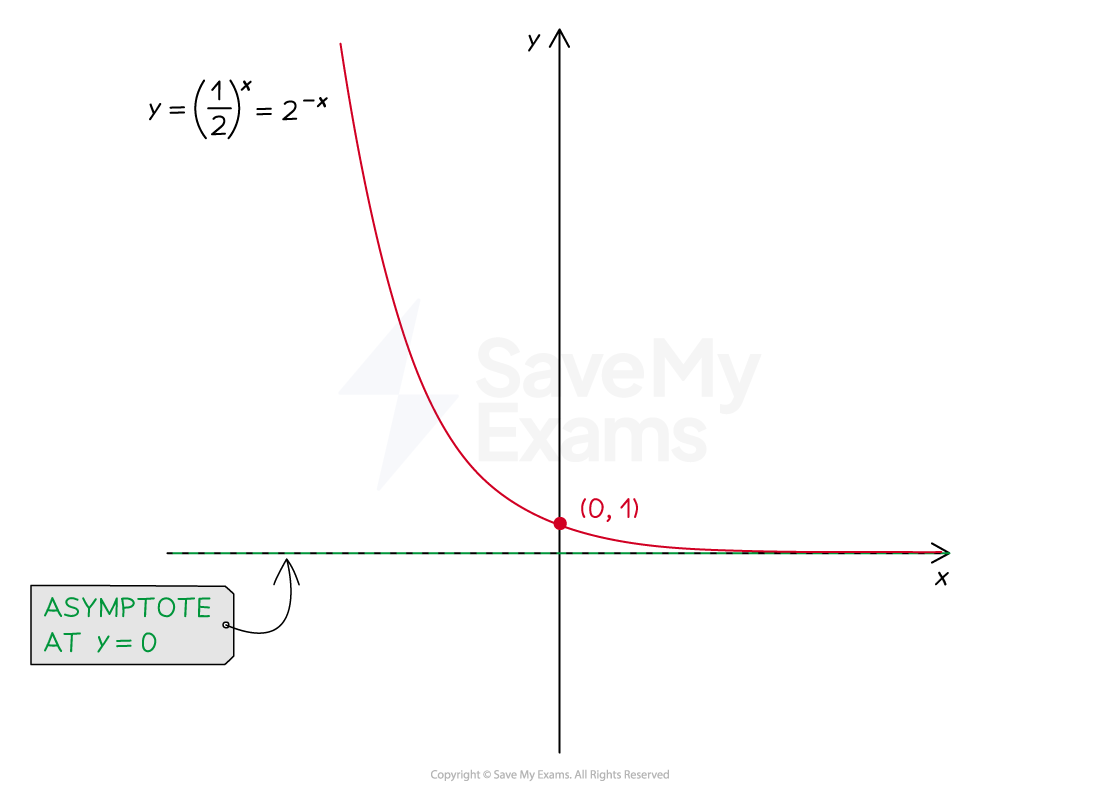
When , represents exponential decay
- is positive but less than 1
- Values of y decrease as x increases
-
-
Graphs of both exponential growth and exponential decay
- have a horizontal asymptote at
- do not have a vertical asymptote
- have a -intercept of
-
Exponential decay can also be identified by a negative power using index laws
- This has the form where
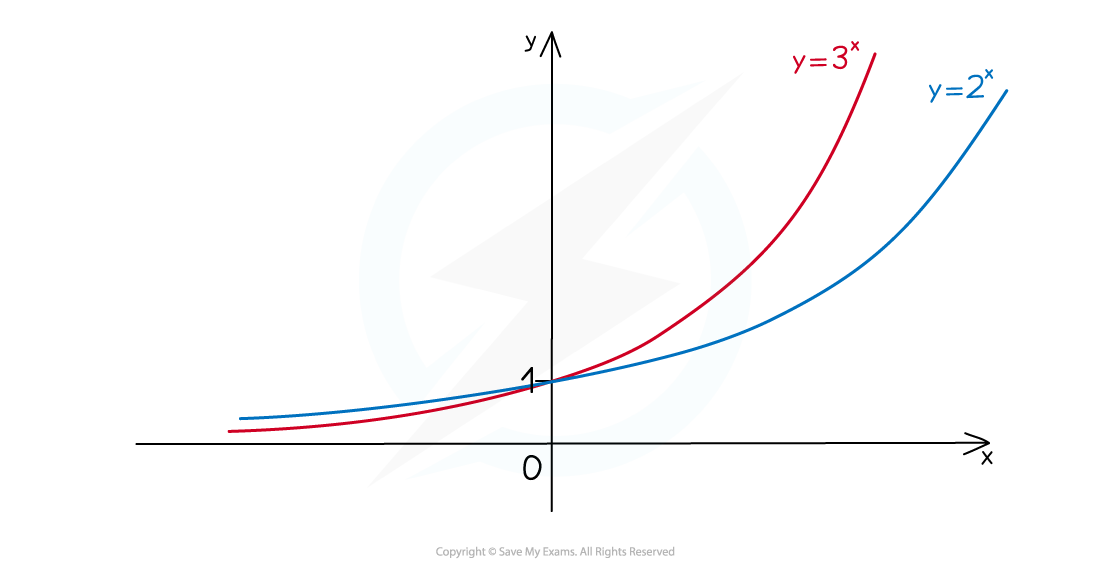
How do I compare exponential graphs?
-
For where:
-
The graph with a higher value of is the “higher” graph for
- but the "lower" graph for
-
-
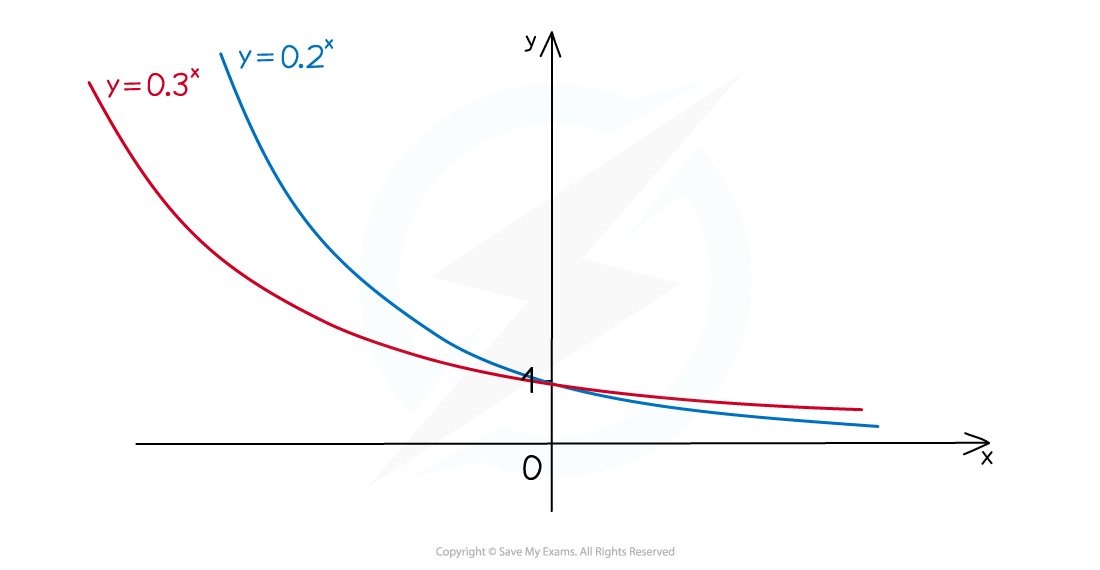
For where:
-
The graph with a higher value of is the “higher” graph for
- but the "lower" graph for
-
Worked Example (a) Identify the equation that shows exponential decay.
A:
B:
C:
D:
A is an exponential graph as the x is in the power *The base number is greater than 1 so it is **exponential growth *(not decay)
B has the x as the denominator in a fraction It is a reciprocal graph
C is an exponential graph as the x is in the power The base number is between 0 and 1 so it is* exponential decay*
D has* x *raised to the power 3 It is a cubic graph
Final answer: **C:****shows exponential decay
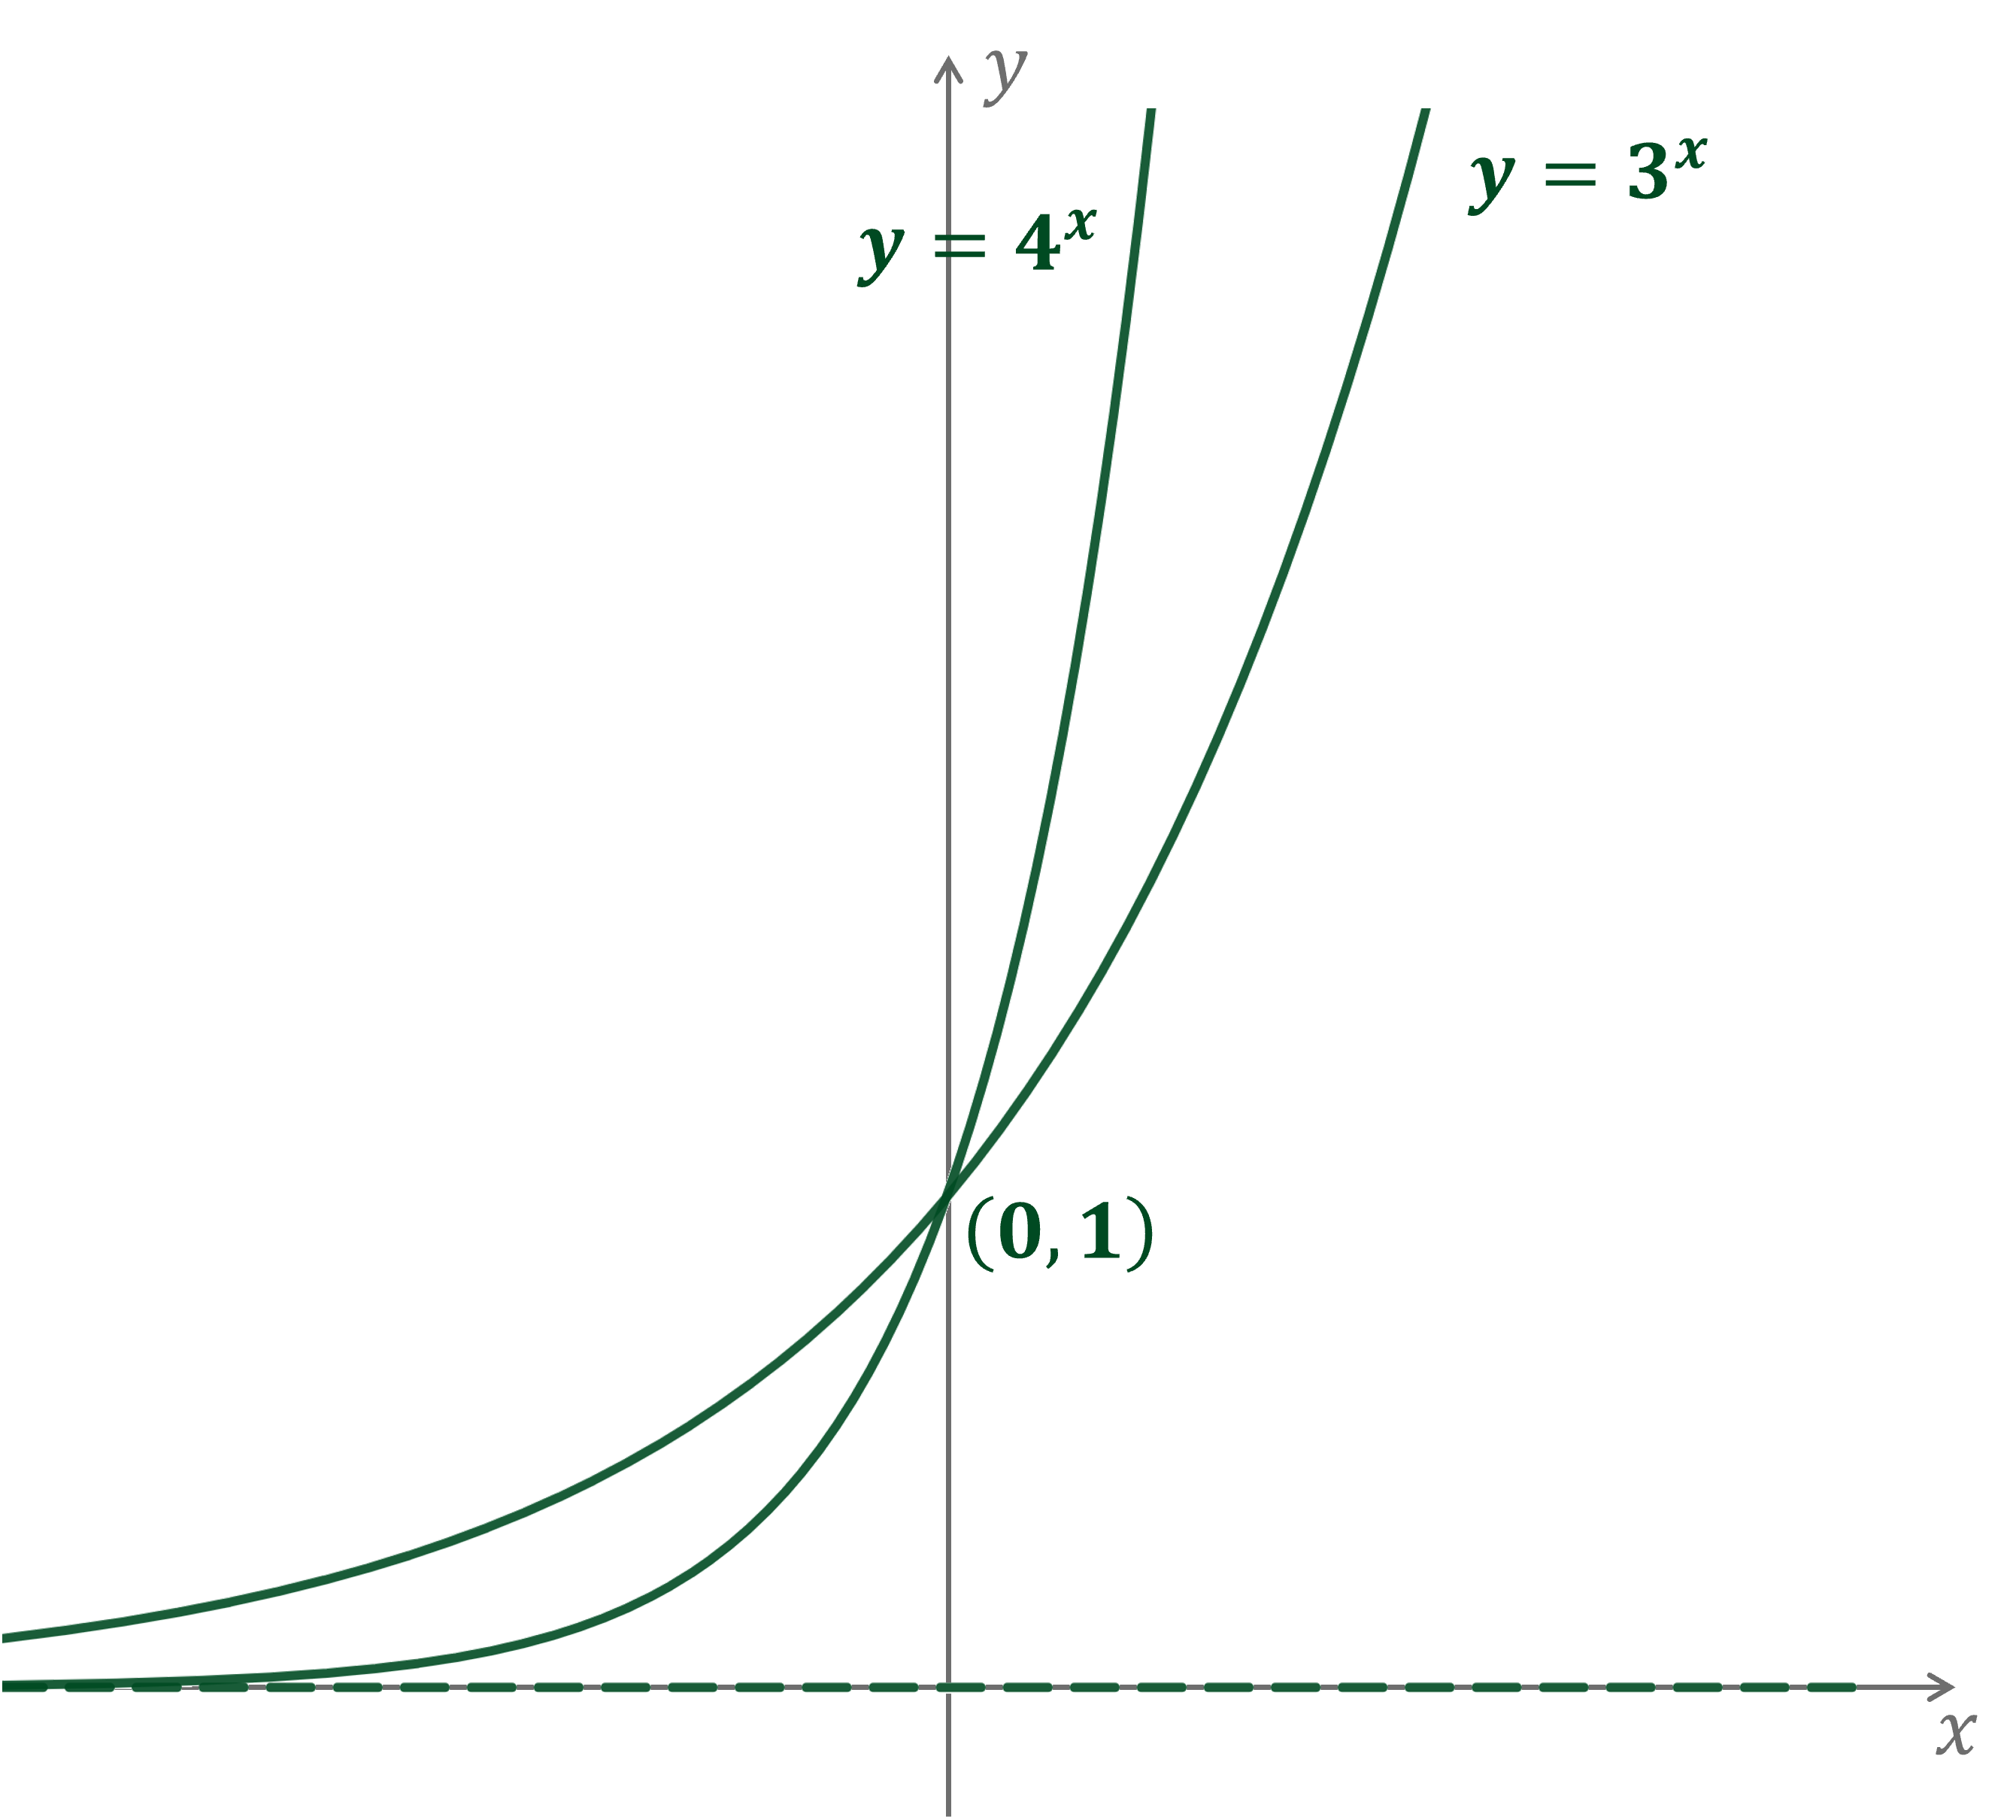
(b) On the same set of axes, sketch the graphs of and .
Both graphs will have the "typical" exponential growth shape for
will be the "higher" graph for and "lower" graph for
Both graphs go through and have an asymptote along the -axis
Was this revision note helpful?
Build on this topic