Using Calculators to Solve Inequalities (Cambridge International IGCSE Maths)
Using Calculators to Solve Inequalities
How do I solve inequalities using my graphic display calculator?
-
You can use a graphic display calculator to solve inequalities of the form
straight f_ 1 (x) greater than straight f_ 2 (x)orstraight f_ 1 (x) less than straight f_ 2 (x)- or
-
First, turn the inequality into an equation and solve
- Read the revision note on Using Calculators to Solve Equations to see how
- The solutions to the equation are the x-coordinates of the points of intersection of the two graphs and
-
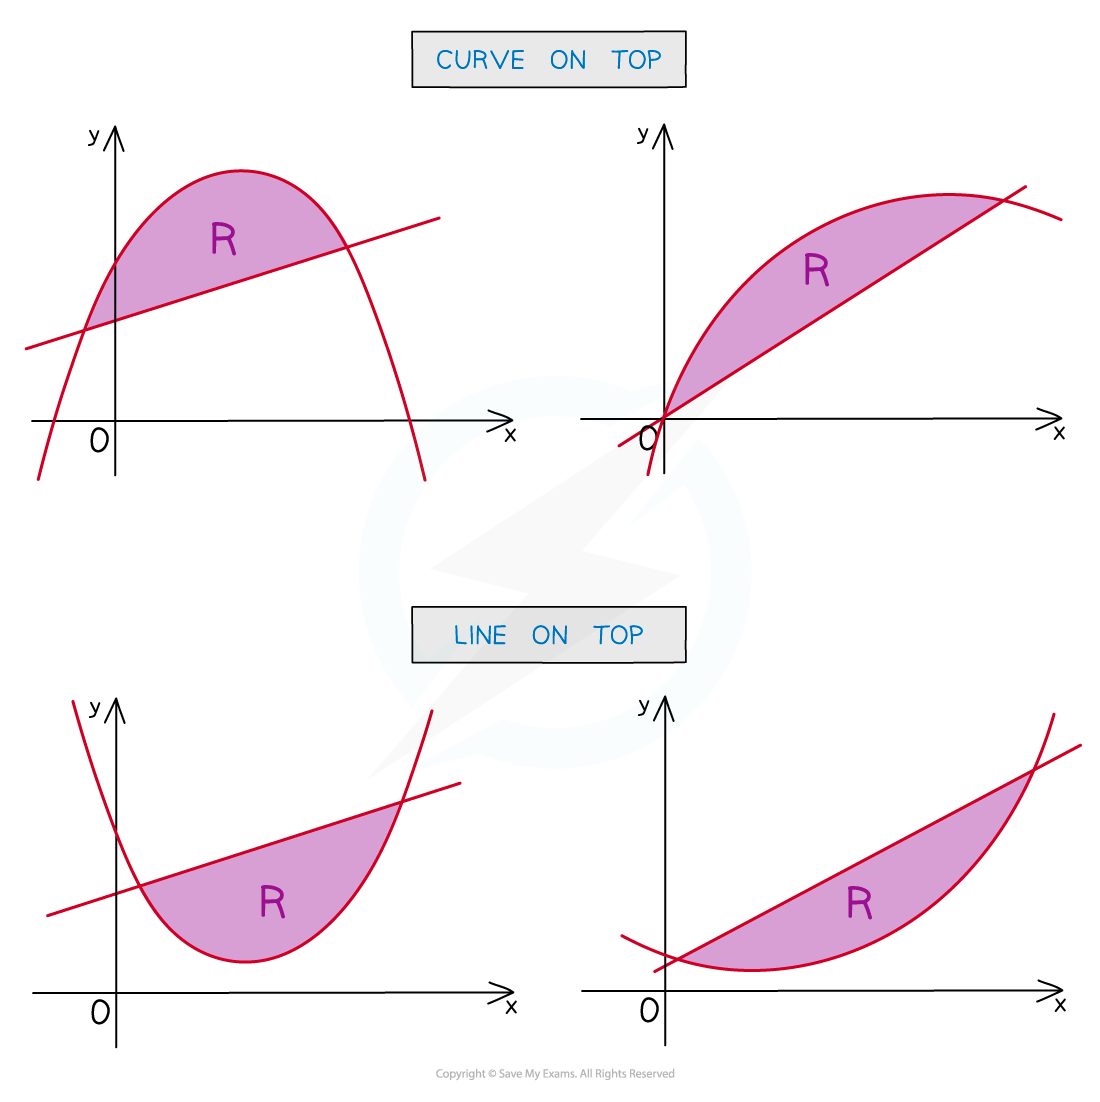
Then look at the regions (areas) enclosed between the two graphs and decide which curve is the top curve and which is the bottom curve
-
e.g. The solution to
straight f_ 1 (x) greater than straight f_ 2 (x)are the ranges of x-values for which is the top curve and is the bottom curve- The top curve is greater than the bottom curve
-
Examples of different regions, R, are shown below
-
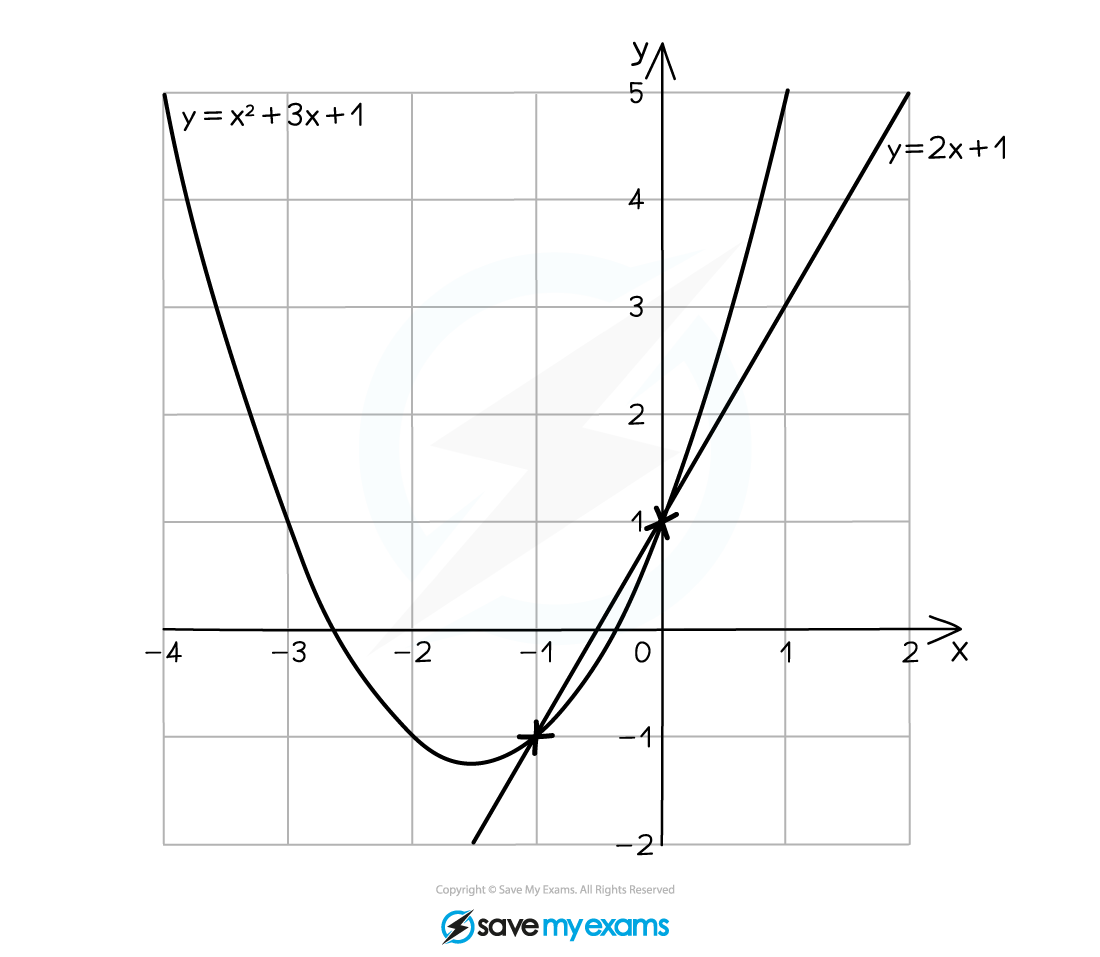
For example, to solve using a graphical method
- First solve the "=" equation to get and
- Then plot on your calculator and look for any regions where the quadratic is above (greater than) the line (quadratic on top, line on bottom)
- This happens to the left of and to the right of
- The solution is or
-
Exam Hint Remember to give your solutions as ranges of x values, using strict inequalities if the question uses strict inequalities!
Worked Example Use a graphical method to solve the inequality , giving your answers correct to 1 decimal place and showing a sketch of the graph.
Start a new graph on your calculator and enter
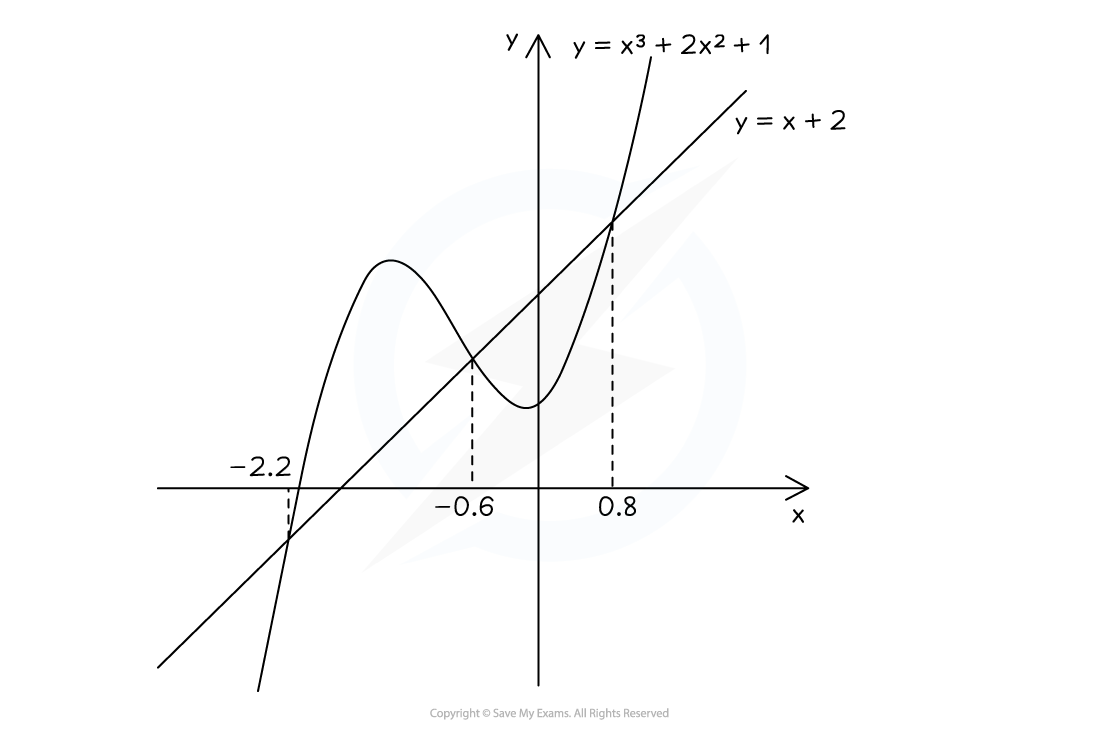
straight f_ 1 (x)=x³+2x²+1to generate the graph Add on the second graph ofstraight f_ 2 (x)=x+2Select the option to "analyze" the graph (this may be labelled as G-Solv) Choose the option "intersections" to find the coordinates of the 3 points of intersection
The solutions to the equation are the x-coordinates of the points of intersection
The solutions to the equation are
,* or to 1 d.p.
The inequality in the question is "cubic graph straight line graph" Look at regions where the cubic is the bottom curve and the line is above
left of x = -2.2 and between x = -0.6 and x = 0.8
The solutions are the ranges of x-values over which these regions lie Write your final answer using non-strict inequalities (to match the question)
Final answer: orto 1 d.p.
Was this revision note helpful?
Build on this topic