Types of Graphs (Cambridge International IGCSE Mathematics)
Types of Graphs
What types of graphs do I need to know?
-
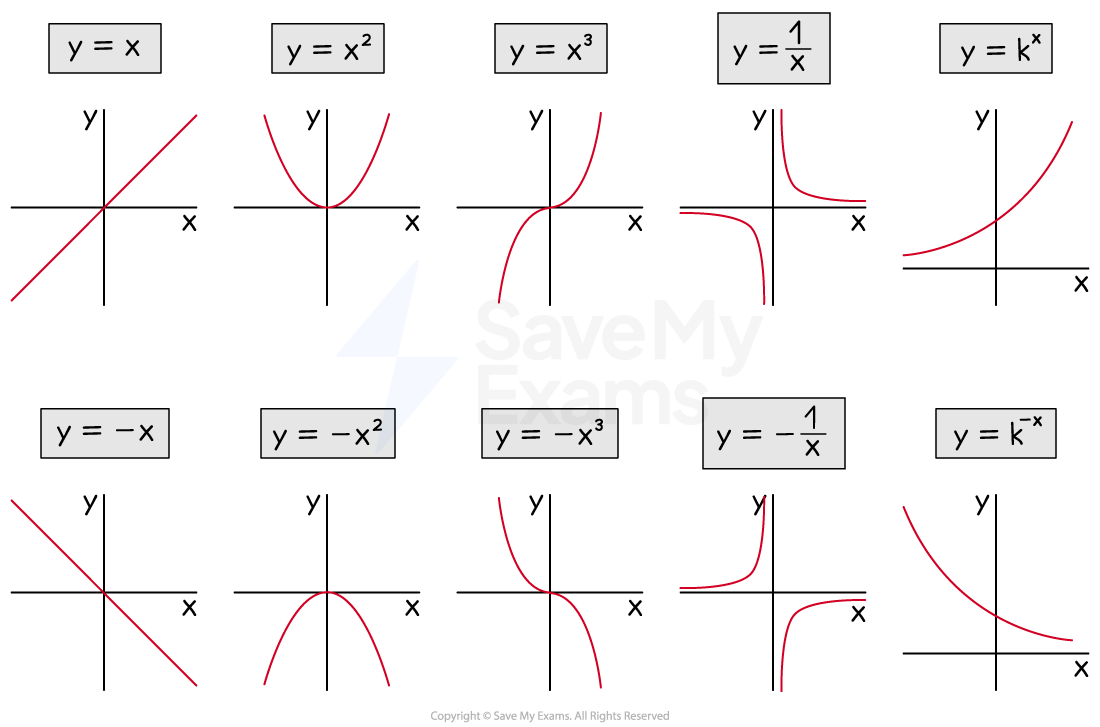
You need to be able to recognise, sketch, and interpret the following types of graph:
-
Linear ()
- or
-
Quadratic()
-
Cubic()
- or
-
Reciprocal ()
-
Exponential ()
-
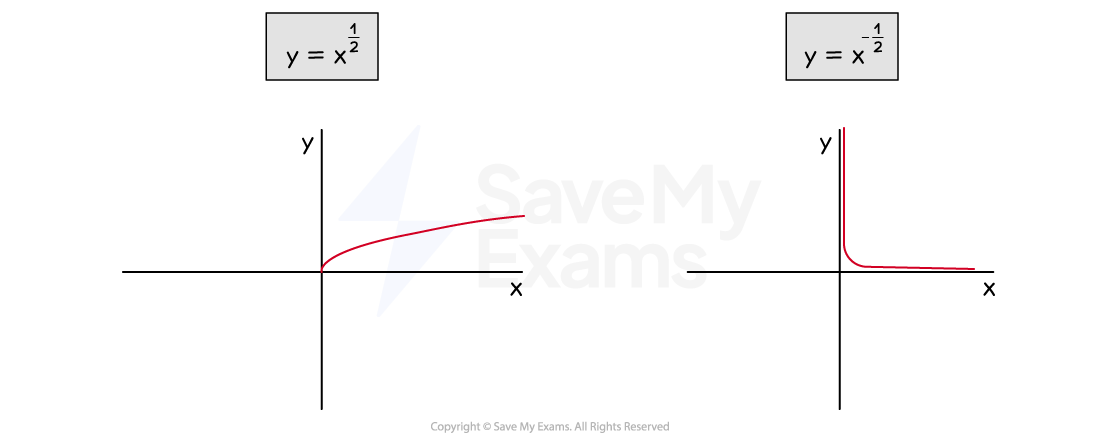
- You may also need to recognise the graphs and
- These are equivalent to and
- You must also be able to recognise the three basic trigonometric graphs, covered in the Trigonometry section
Where are the asymptotes on reciprocal graphs?
-
An asymptote is a line on a graph that a curve becomes closer to but never touches
- These may be horizontal or vertical
-
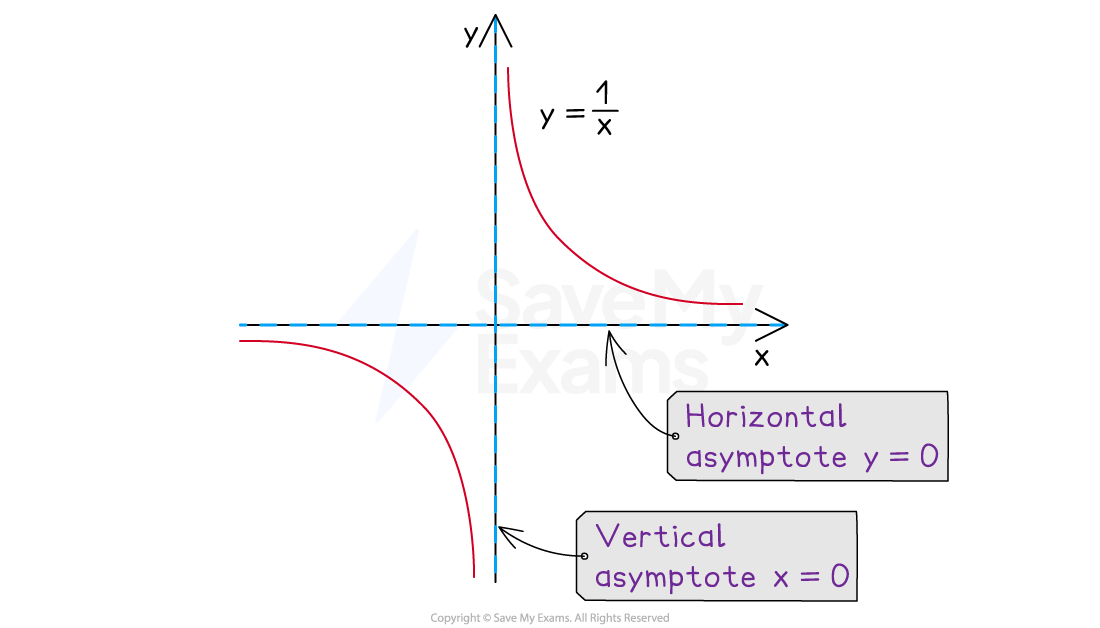
The reciprocal graph, (where is a constant)
- does not have a y-intercept
- and does not have any roots
-
This graph has two asymptotes
-
A horizontal asymptote at the x-axis:
- This is the limiting value when the value of x gets very large (or very negative)
-
A vertical asymptote at the y-axis:
- This is the value that causes the denominator to be zero
-
-
The reciprocal graph, (where and are both constants)
-
is the same shape as
-
but is shifted upwards by units
- would be shifted down by 3 units
-
This means the horizontal asymptote also shifts up by units
- The asymptote of would be
-
The vertical asymptote remains on the y-axis
-
-
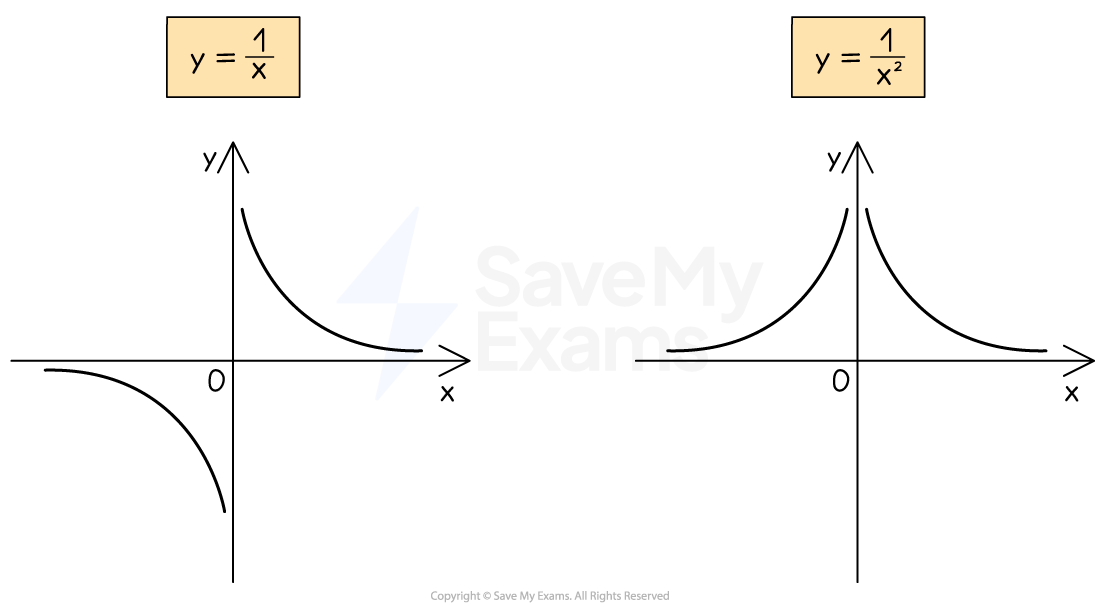
The graph of is similar to but has two key differences
- is steeper than
- is always positive, even when is negative
How do I draw exponential growth and decay?
-
The equation represents exponential growth when
-
represents exponential decay when
- is positive but less than 1
-
-
Both of these graphs:
- have a horizontal asymptote at
- do not have a vertical asymptote
- have a -intercept of
-
The graph of is a similar shape to , but there are some differences
-
It is first stretched vertically by
-
It is then shifted units upwards
- Therefore it has a horizontal asymptote at
- and a -intercept of
-
-
For example, a population may be modelled as , where is the population and represents time
-
This is an exponential decay as
-
The initial population (when ) will be 400 + 100 = 500
- The -intercept is (0, 500)
-
Over a long period of time (large -value) the population will settle to 100
- The asymptote is at
-
-
Exponential decay can also be identified by a negative power using index laws
- so is the model above
- This has the form where
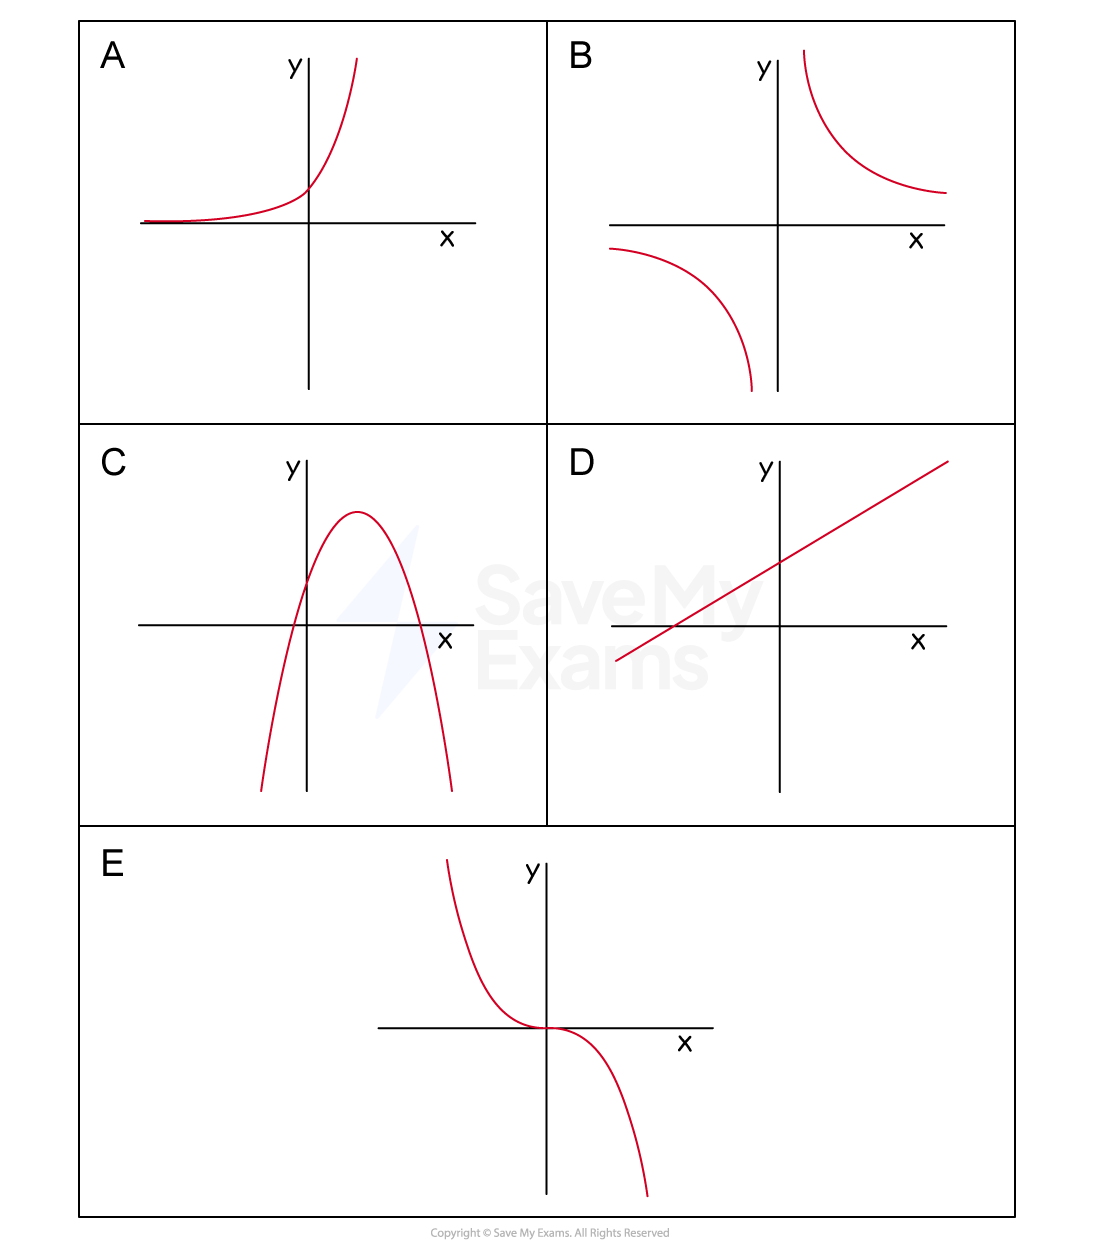
Worked Example Match the graphs to the equations.
(1), (2), (3), (4), (5)
Answer:
Starting with the equations,
(1)is a linear equation (y = mx + c) so matches the only straight line, graph D
(2) is an exponential equation with a positive coefficient so matches graph A
*(3) **is a cubic equation with a negative coefficient so matches graph *E
(4)* is a reciprocal equation with a positive coefficient so matches graph** B*
(5) is a quadratic equation with a negative coefficient so matches graph C
Final answer: Graph A → Equation 2
Final answer: Graph B → Equation 4
Final answer: Graph C → Equation 5
Final answer: Graph D → Equation 1
Final answer: Graph E → Equation 3
Was this revision note helpful?
Build on this topic