11 markeasy
(d)
Find the value of .
........................
21 questions · 62 marks · ≈ 62 min · spans 21 of 44 topics
Assembled from the topic question banks — not an official Cambridge International paper
Find the value of .
........................
Factorise completely.
is an integer.
Write down all the possible values of .
Simplify
Work out the value of when and
Solve the following equation.
Make the subject of the following formula
.............................
These are the first four terms of a sequence.
| 8 | 15 | 22 | 29 |
|---|
i) Write down the next term.
(1 mark)
ii) Write down the term to term rule for continuing this sequence.
(1 mark)
iii) Find an expression for the nth term.
(2 marks)
Find the first three terms of the sequence with th term .
A plant costs dollars and a bush costs dollars. Ana buys 2 plants and 4 bushes for $42. Paola buys 7 plants and 9 bushes for $107.
Write down a pair of simultaneous equations and solve them to find the value of and the value of . You must show all your working.
Complete the table of values for
| -5 | -3 | -2 | -1 | 1 | 2 | 3 | 5 | ||
|---|---|---|---|---|---|---|---|---|---|
| -15 | 15 |
Extract:
| x | -5 | -3 | -2 | -1 | | 1 | 2 | 3 | 5 | | y | | | | -15 | | 15 | | | |
On the grid, draw the graph of for negative 5 less-than or slanted equal to x less-than or slanted equal to negative 1 and 1 less-than or slanted equal to x less-than or slanted equal to 5.
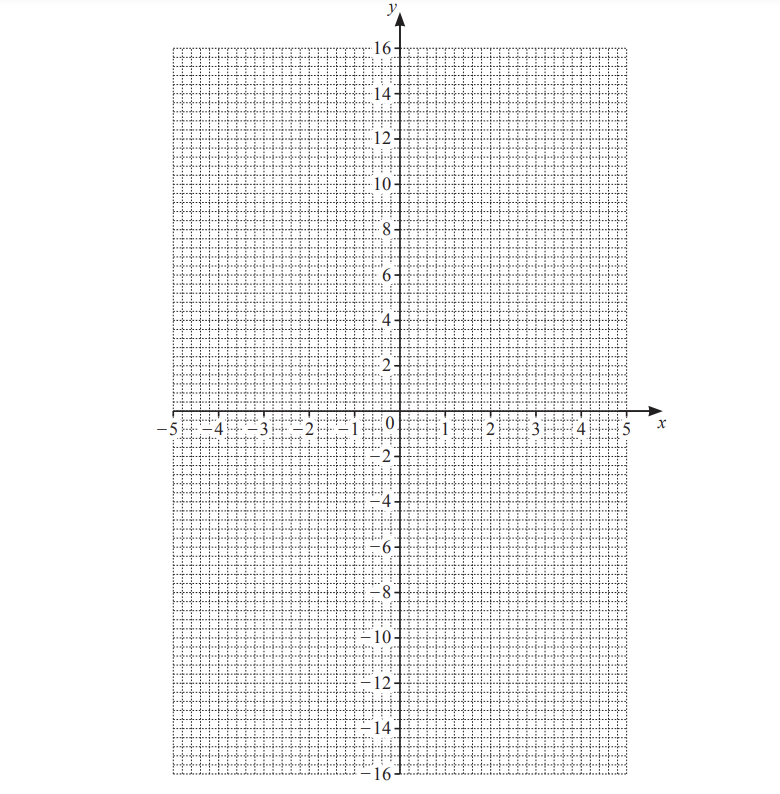
On the grid, draw the line = 6.
Extract:
On the grid, draw the graph of y = 15 over x for negative 5 ≤ x ≤ negative 1 and 1 ≤ x ≤ 5. On the grid, draw the line y = 6.
Use your graph to solve .
.............................
Find the co-ordinates of the point where the line crosses the -axis.
The diagram shows a conversion graph for dollars and Kenyan shillings.
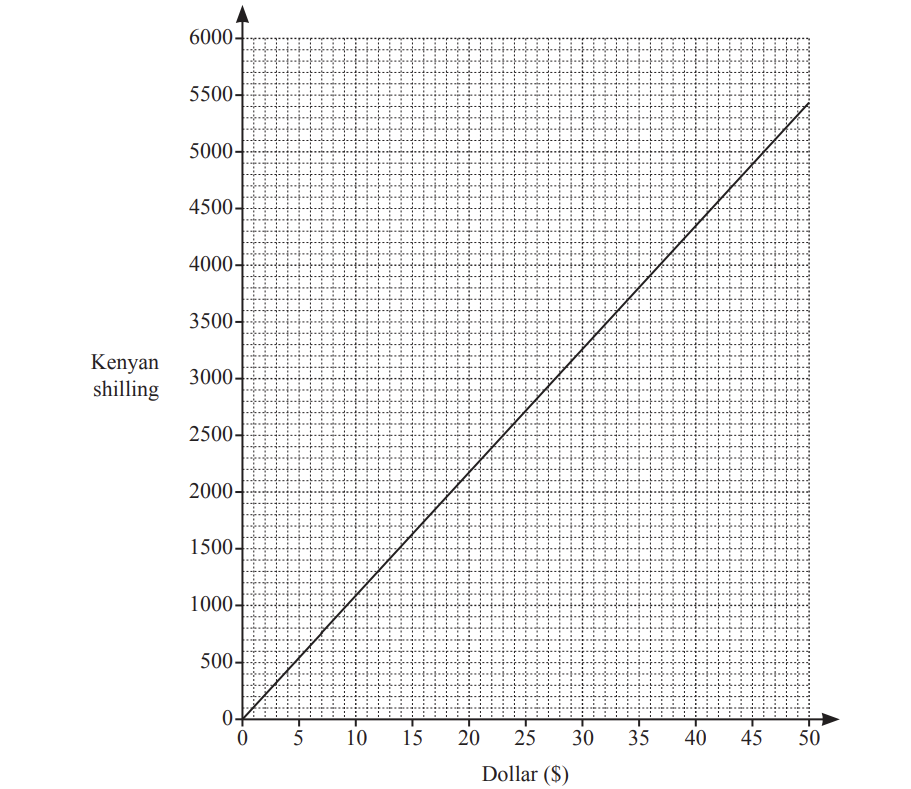
Use the graph to change 5000 shillings to dollars.
$....................................................
Extract:
The diagram shows a conversion graph for dollars and Kenyan shillings.
Explain how to use this graph to change $420 to shillings.
Extract:
The diagram shows a conversion graph for dollars and Kenyan shillings.
The exchange rate is now $1 = 90 shillings.
On the grid, draw another line to show this exchange rate.
The diagram shows a triangle between two parallel lines, and .
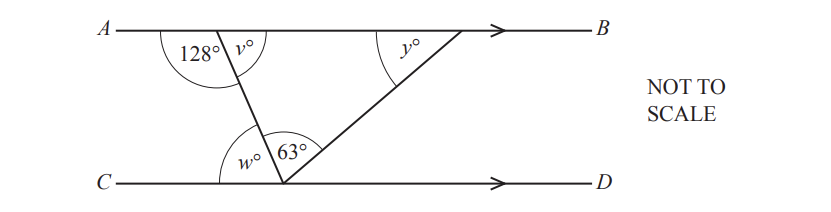
Find the value of
i)
=............................. [1]
ii)
............................. [1]
iii) .
= ............................. [1]
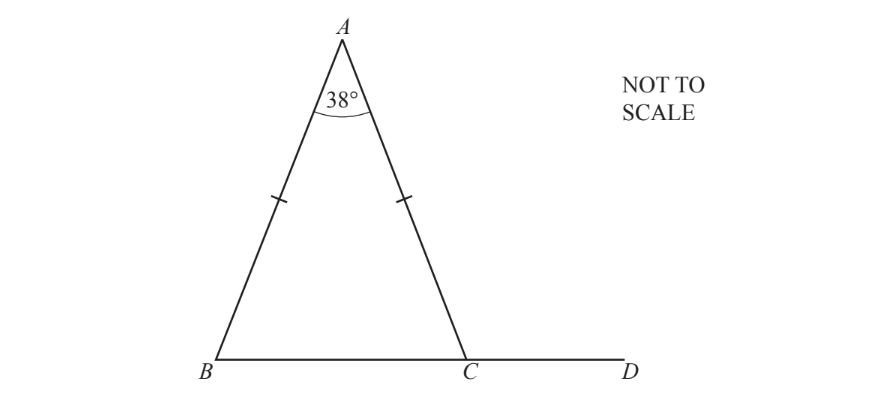
In the triangle and angle .
is a straight line.
Work out angle .
Angle = ..................................................
The scale drawing shows the positions of town and town . The scale is 1 centimetre represents 15 kilometres.
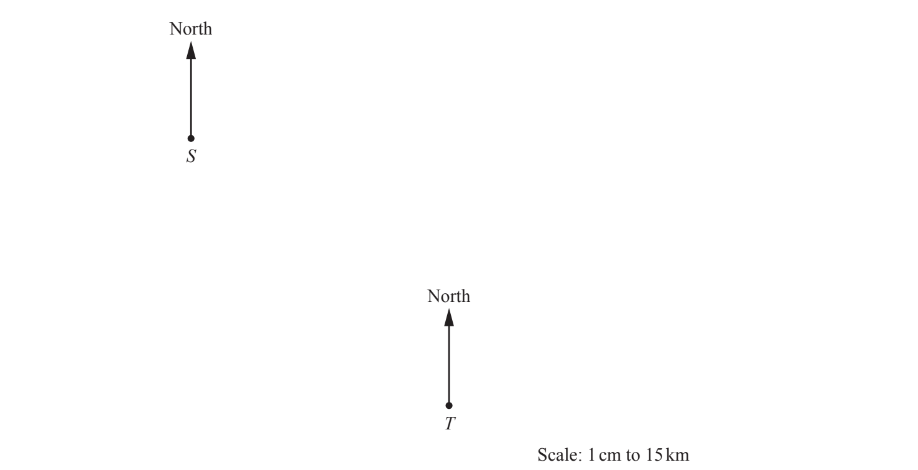
i) Find the actual distance between these two towns.
....................................... km [2]
ii) Measure the bearing of town from town .
(1 mark)
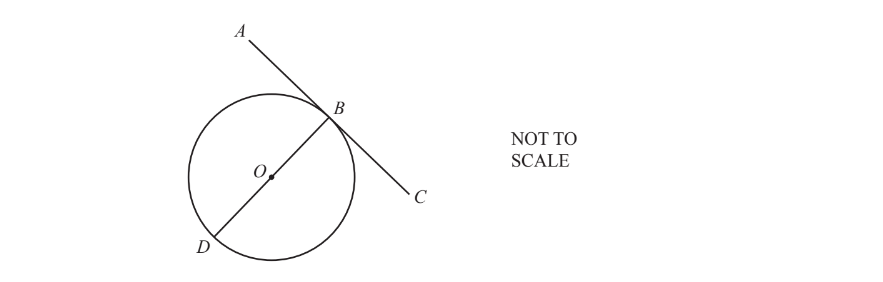
In the diagram, and are points on the circumference of a circle, centre . is a straight line touching the circle at only and is a straight line through .
Complete the statement.
Angle = ................ because ...........................
.
Shade two more squares so that this grid has rotational symmetry of order 4.

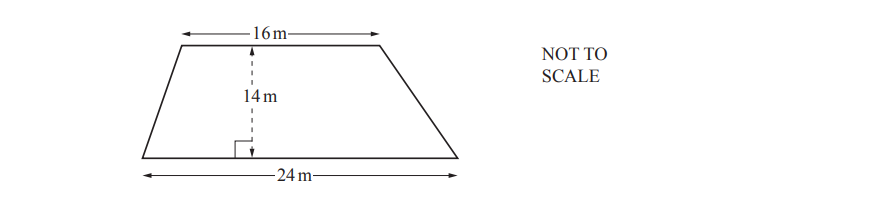
Calculate the area of this trapezium.
.................................. m2
Calculate the circumference of a circle with radius 4.5cm.
.............................................. cm
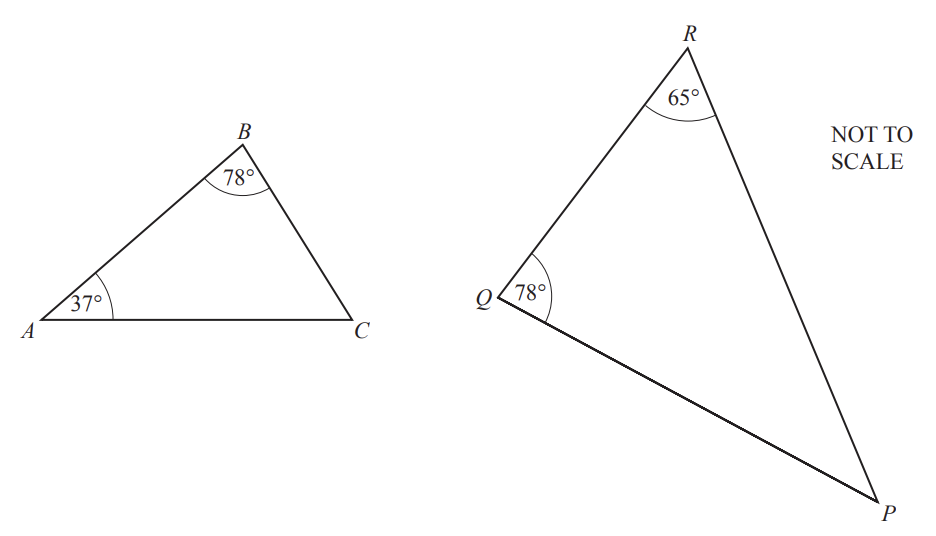
Explain why triangle is similar to triangle .
A cylinder has a radius of 6 cm and a height of 17 cm.
Show that the volume of this cylinder is 1923 cm3, correct to 4 significant figures.
Andy is doing a 60 kilometre sponsored cycle ride.
He leaves the starting point at 1000, stops briefly at the first stopping point, and then cycles on to the second stopping point.
The travel graph shows Andy's journey.
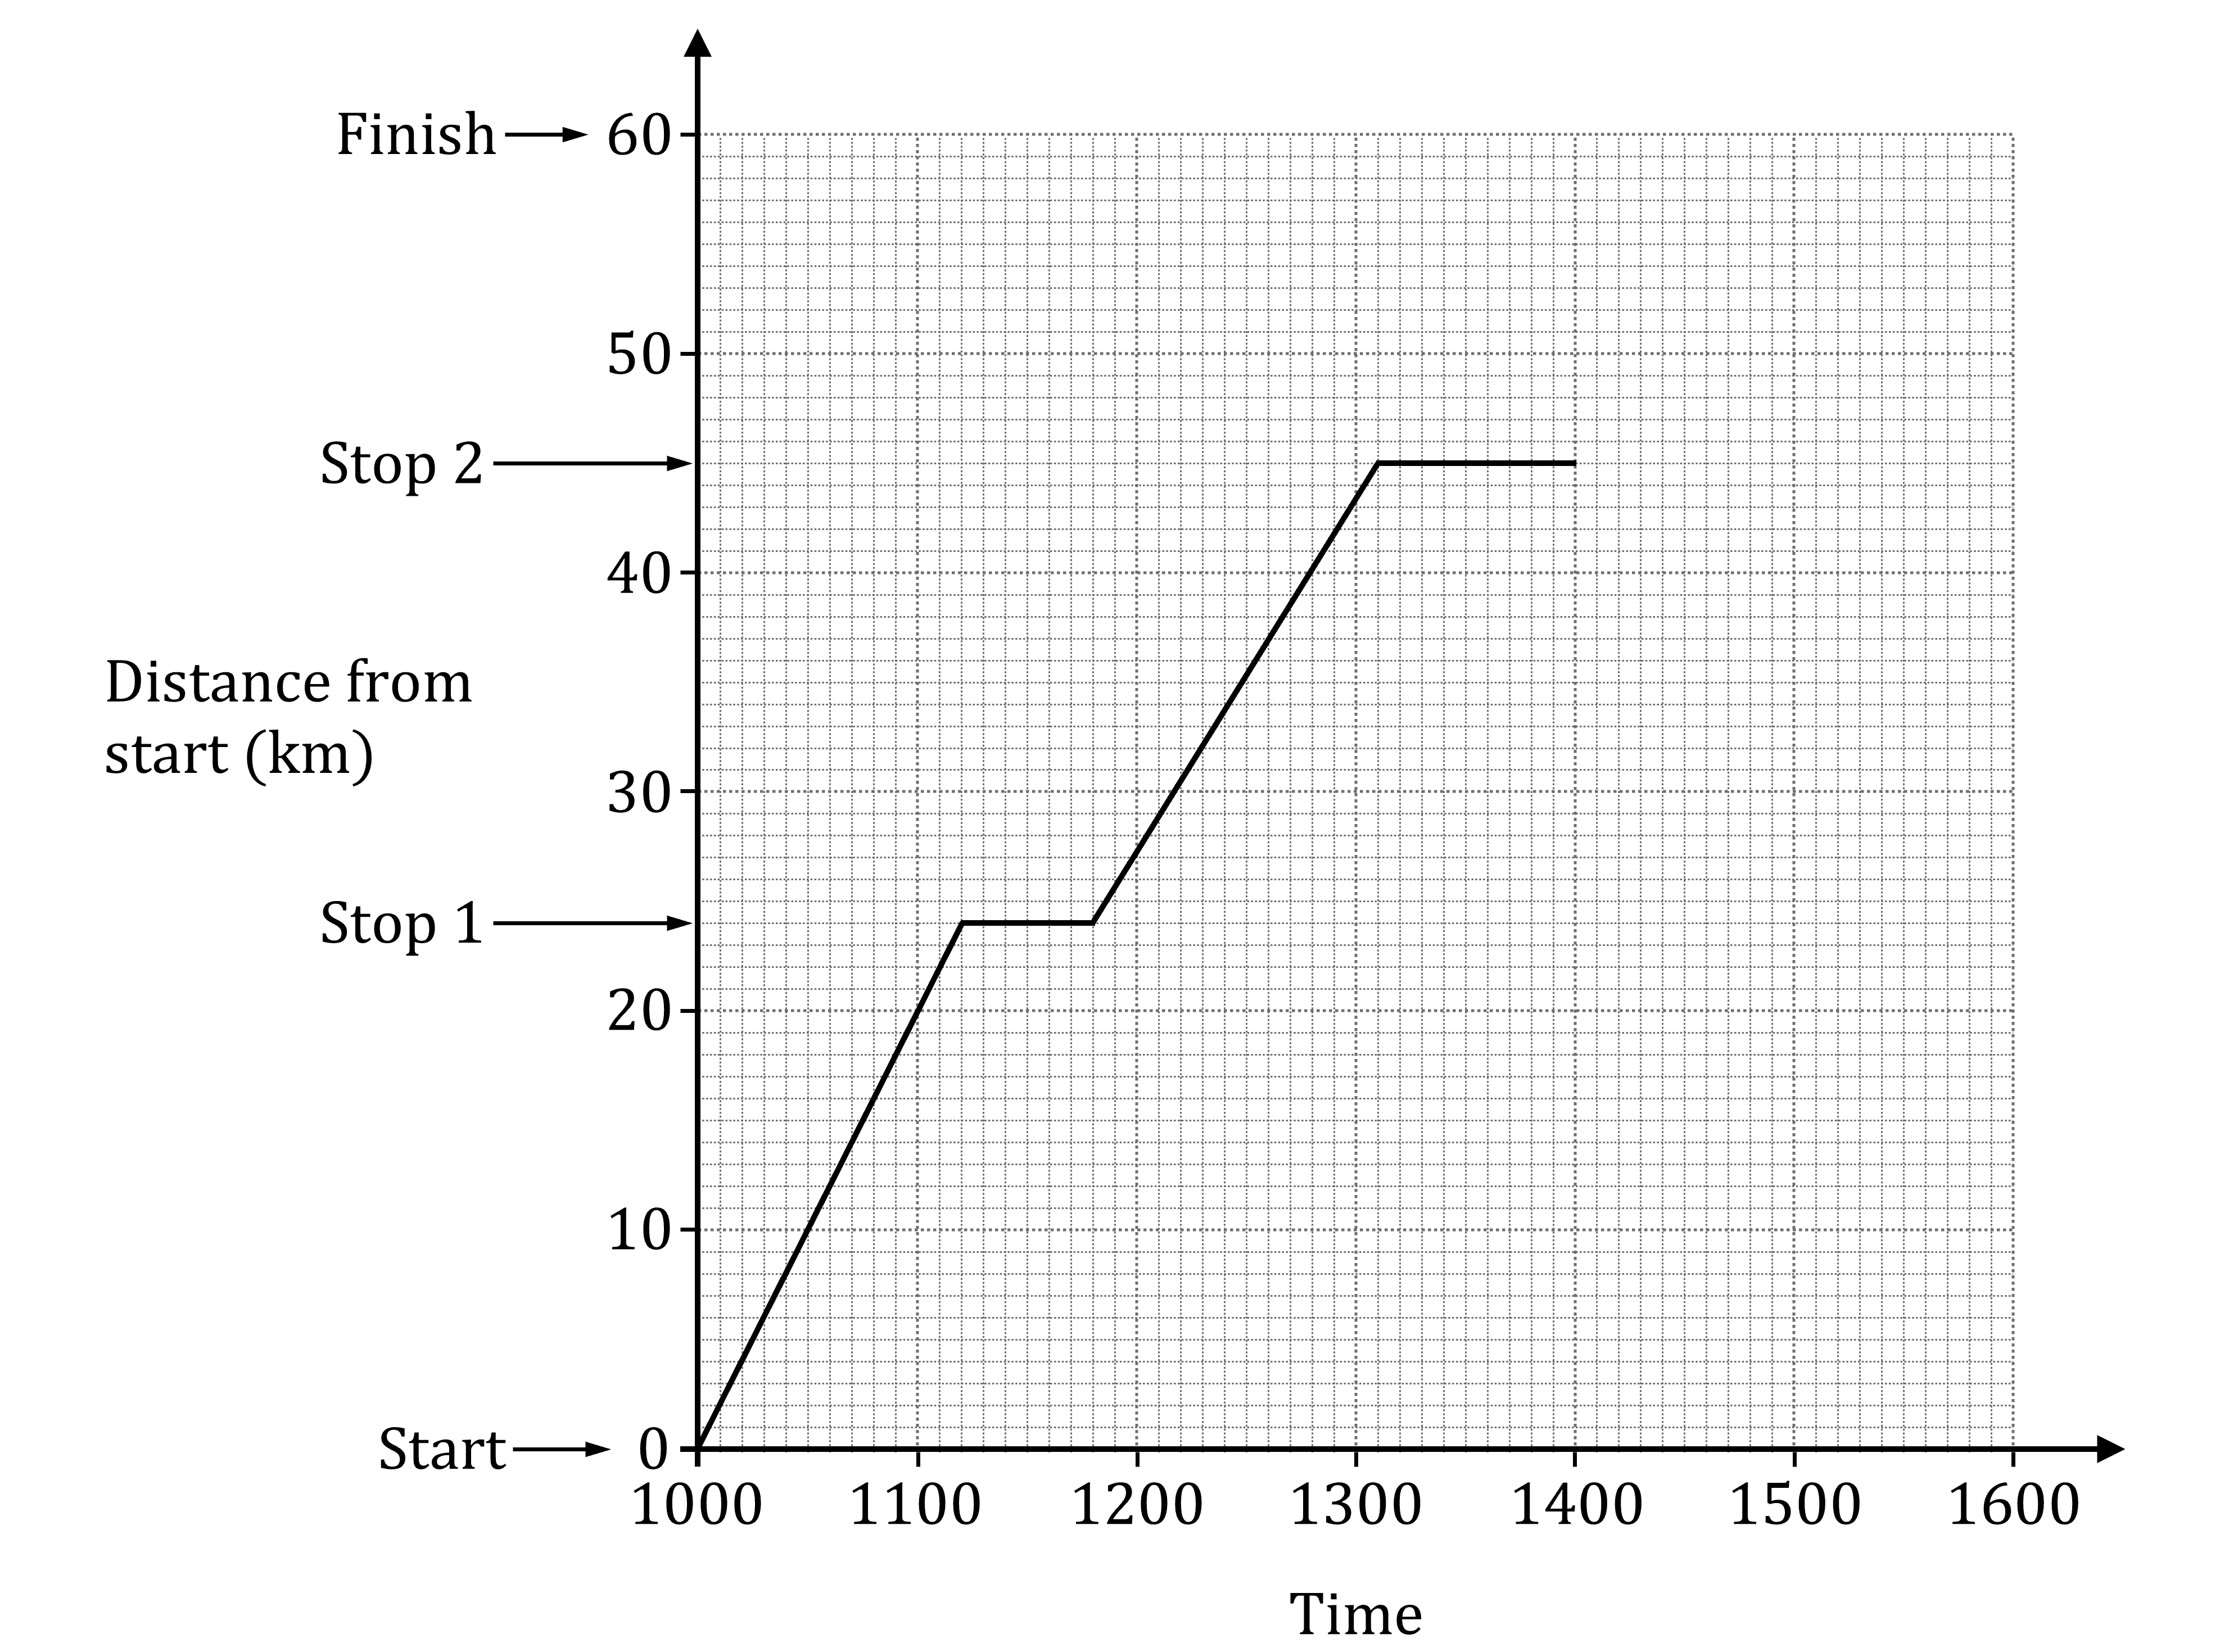
Find Andy’s average speed, in kilometres per hour, from 'Start' to 'Stop 1'.
....................................... km/h
Extract:
Andy is doing a 60 kilometre sponsored cycle ride.
He leaves the starting point at 1000, stops briefly at the first stopping point, and then cycles on to the second stopping point.
The travel graph shows Andy's journey.
Graph showing distance over time, with stops at 24 km and 45 km. Vertical axis (distance) goes from 0 km to 60 km, horizontal axis (time) goes from 1000 to 1600. Part of journey from Start to Stop 2 is shown. 'Finish' is marked at 60 km.
Andy leaves 'Stop 2' at 1400. He continues to the Finish point at a constant speed of 13 kilometres per hour.
(i) Calculate the time Andy takes to travel from 'Stop 2' to 'Finish'.
(1 mark)