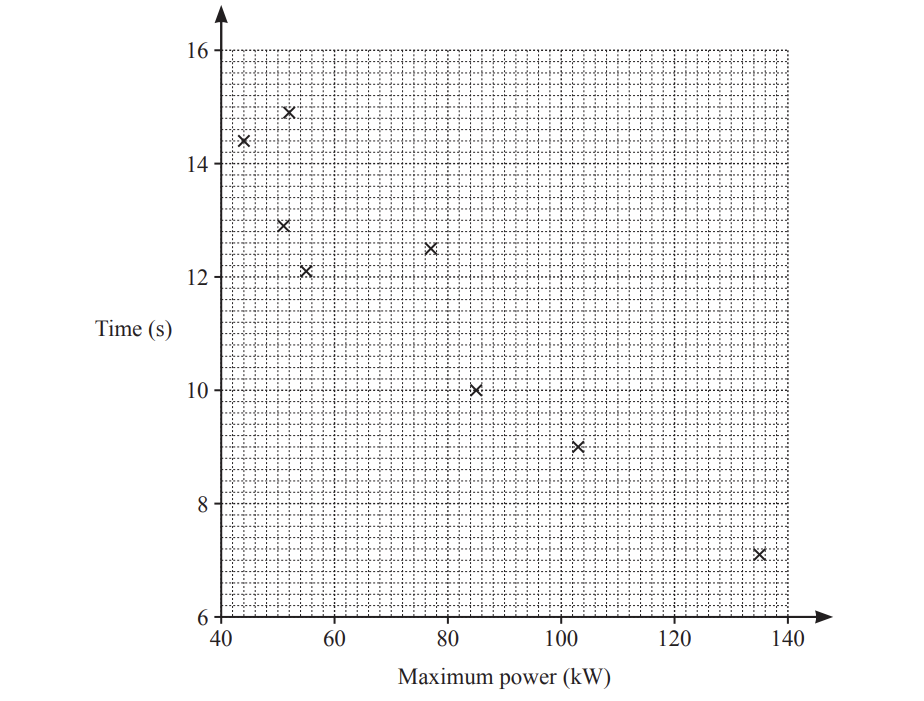
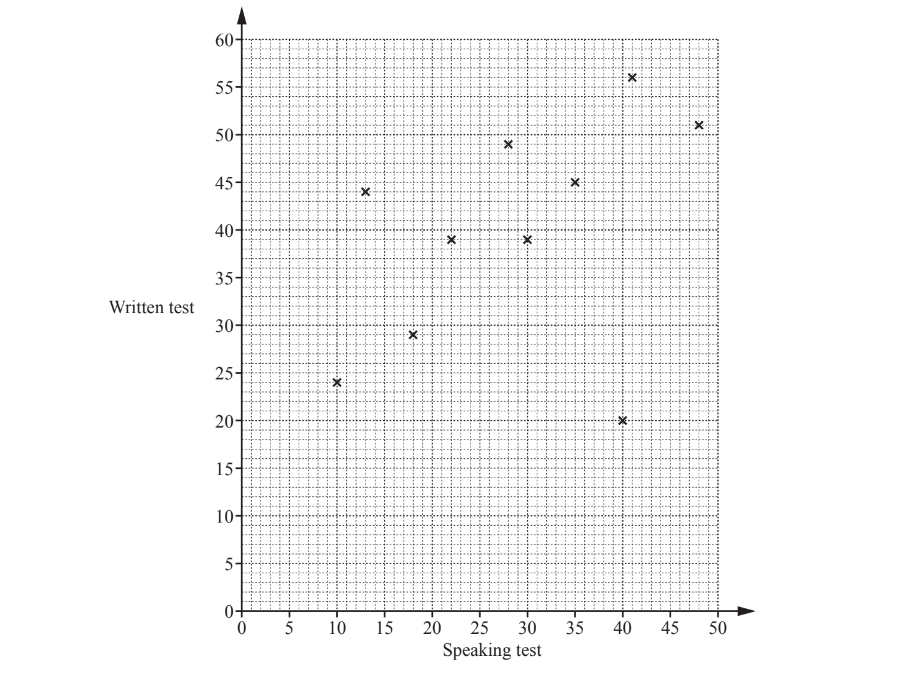
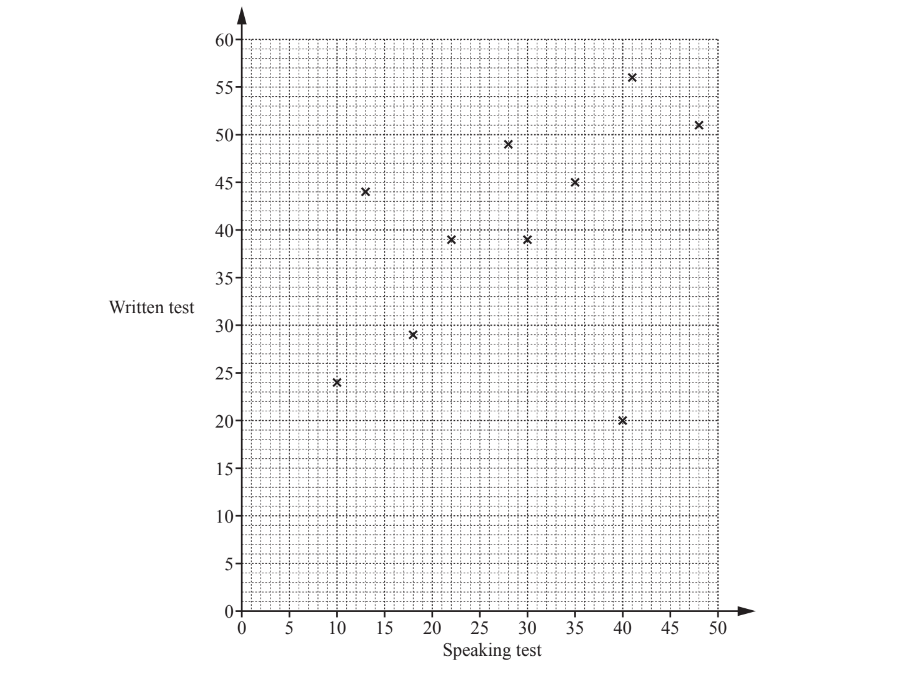
Ten athletes compete in both the 100 metre race and the triple jump. Their results are shown in the scatter diagram.
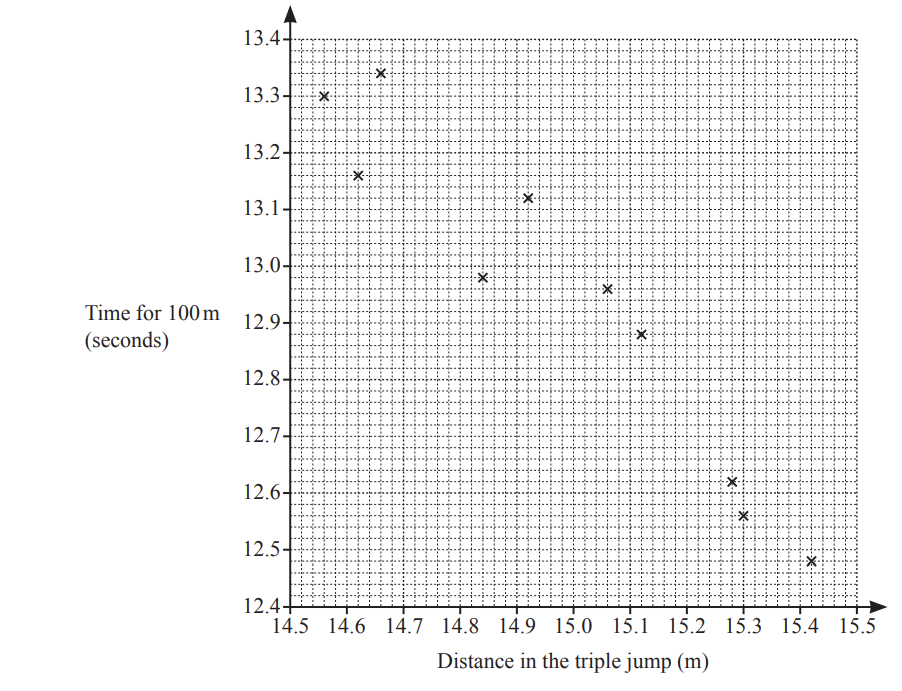
One of these athletes jumps 15.12m in the triple jump.
Write down his time for the 100 metre race.
.................................................. s
Extract:
Ten athletes compete in both the 100 metre race and the triple jump. Their results are shown in the scatter diagram.
The values for two other athletes are shown in the table.
| Distance in the triple jump (m) | 14.74 | 15.2 |
|---|---|---|
| Time for 100m (seconds) | 13.2 | 12.76 |
On the scatter diagram, plot these points.
Extract:
Ten athletes compete in both the 100 metre race and the triple jump. Their results are shown in the scatter diagram. One of these athletes jumps 15.12m in the triple jump. Write down his time for the 100 metre race. The values for two other athletes are shown in the table. | Distance in the triple jump (m) | 14.74 | 15.2 | | Time for 100m (seconds) | 13.2 | 12.76 | On the scatter diagram, plot these points.
On the scatter diagram, draw a line of best fit.
Extract:
Ten athletes compete in both the 100 metre race and the triple jump. Their results are shown in the scatter diagram.
What type of correlation is shown in the scatter diagram?