Trace Tables (Cambridge International IGCSE Computer Science)
Spec point —
6.3.7· "7 Complete a trace table to document a dry-run of an algorithm"
Trace Tables
What is a trace table?
-
A trace table is used to test algorithms and programs for logic errors that appear when an algorithm or program executes
-
Trace tables can be used with flowcharts, pseudocode or program code
-
A trace table can be used to:
- Discover the purpose of an algorithm by showing output data and intermediary steps
- **Record the state of the algorithm **at each step or iteration
-
Each** stage of the algorithm is executed step by step**.
-
Inputs, outputs, variables and processes can be checked for the correct value when the stage is completed
Trace table walkthrough
-
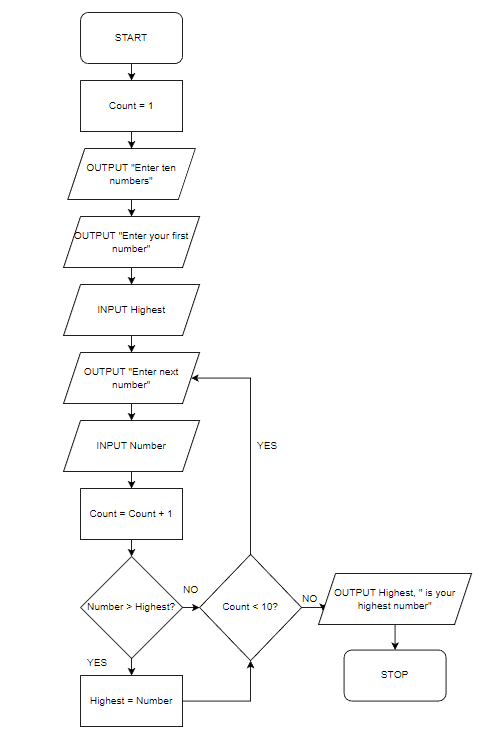
Below is a flowchart to determine the highest number of ten user-entered numbers
-
The algorithm prompts the user to enter the first number which automatically becomes the highest number entered
-
The user is then prompted to enter nine more numbers.
- If a new number is higher than an older number then it is replaced
-
Once all ten numbers are entered, the algorithm outputs which number was the highest
-
Example test data to be used is: 4, 3, 7, 1, 8, 3, 6, 9, 12, 10
| Trace table: Highest number | |||
|---|---|---|---|
| Count | Highest | Number | Output |
| 1 | Enter ten numbers | ||
| 4 | Enter your first number | ||
| 2 | 3 | Enter your next number | |
| 3 | 7 | 7 | |
| 4 | 1 | ||
| 5 | 8 | 8 | |
| 6 | 3 | ||
| 7 | 6 | ||
| 8 | 9 | 9 | |
| 9 | 12 | 12 | |
| 10 | 10 | 12 is your highest number |
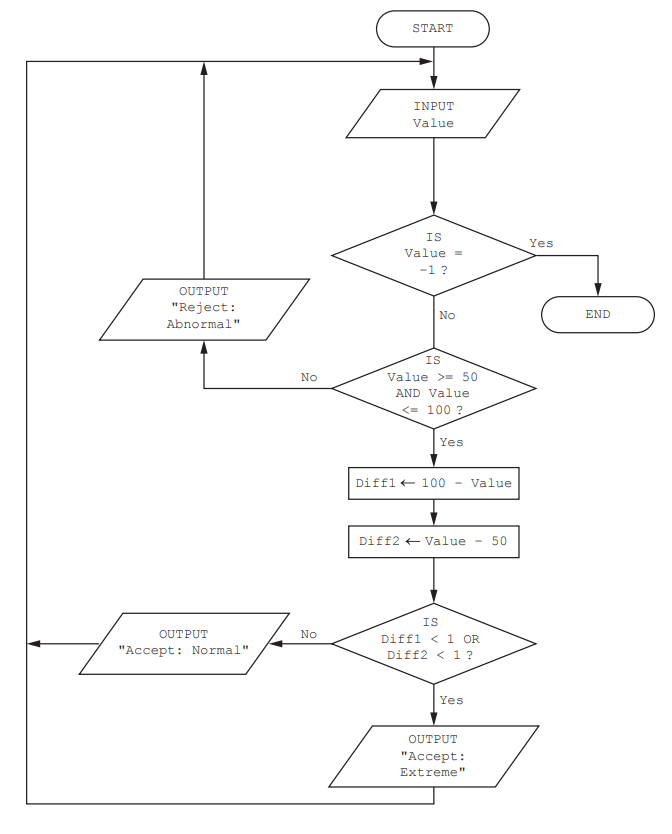
Worked Example The flowchart represents an algorithm. The algorithm will terminate if –1 is entered.
Complete the trace table for the input data: 50, 75, 99, 28, 82, 150, –1, 672, 80
[4]
Value Diff1 Diff2 Output Answer
Final answer: [1] for each correct column
Value Diff1 Diff2 Output 50 50 0 Accept: Extreme 75 25 25 Accept: Normal 99 1 49 Accept: Normal 28 Reject: Abnormal 82 18 32 Accept: Normal 150 Reject: Abnormal -1
Was this revision note helpful?
Build on this topic