Inverse or not?
Excerpt: This graph-matching problem can be used to introduce the principal-value ranges of , and and to reinforce ideas of what happens when functions are composed, using specific examples such as
Problem
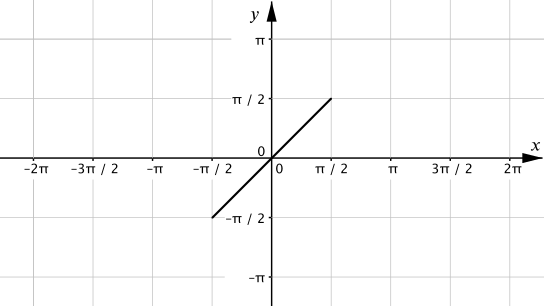
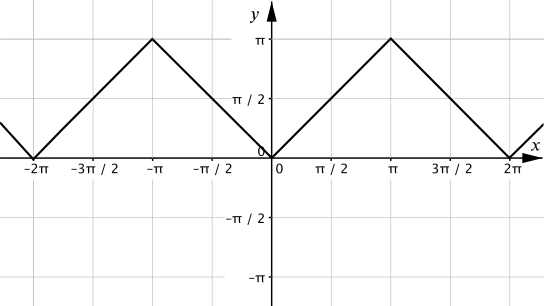
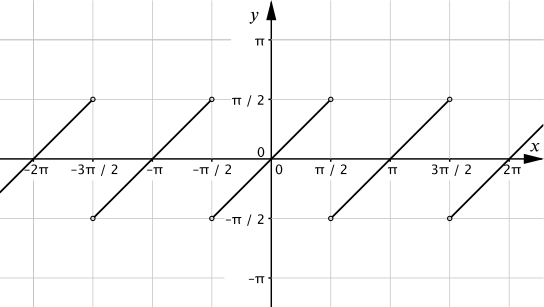
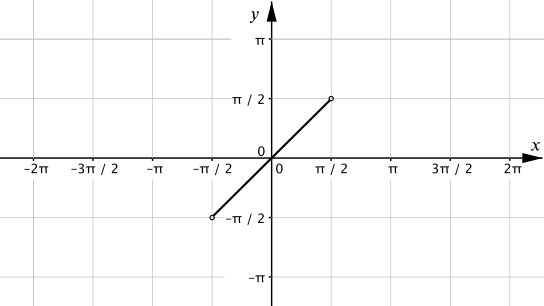
Take a look at the three graphs below.
| Graph A | Graph B |
|---|---|
| Graph C |
One of the graphs shows Another shows . Which graphs are these, and why? (The small open circles on the graphs indicate that these points are excluded.)
Please note that and mean the same thing and both are widely used in books and online. Similarly, and mean the same as one another, as do and .
If you want to know more about , and before working on this task, you may find it helpful to look at Inverse trigonometric functions.
More graphs
Match these equations to the graphs below and explain your reasoning.
For which values of is ? What about ?
What can you say about the solutions of similar equations, such as or ?
Solution
Take a look at the three graphs below.
| Graph A | Graph B | Graph C |
|---|
One of the graphs shows
. Another shows
. Which graphs are these, and why?
As , and are periodic functions, there are many values of that give the same value of , or . This means that inverse functions such as and have to be very carefully defined. You can read more about this in Inverse trigonometric functions, and these ideas are used in this solution.
Looking at the three graphs, I notice that Graph C looks like a graph of for all real values of In contrast, Graph B looks like a graph of but only for in the interval . Having thought about Graph B, I can now think of Graph A as a repeating version of Graph B, with period .
To see which graphs show the functions and I can think about domains and ranges.
When composing functions and to form , I need to think about the domain of . I need to check that any output of is in the domain of and what these outputs are, so the range of depends on the domain and range of as well as the range of .
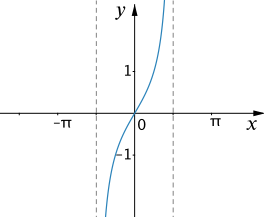
Starting with the inner function in , I know that is defined for all real except where . This is the domain of . The range is the whole of the real numbers. This means the input to the outer function is all the real numbers, so the output for is its principal value range, which is the interval . Therefore, the graph of has a domain which is the whole of the -axis except the points where , and the range is , so Graph A shows .
I’ll now use similar thinking to work out which is the graph of . This time is the inner function. Its domain is the whole of the real numbers, but the range is .
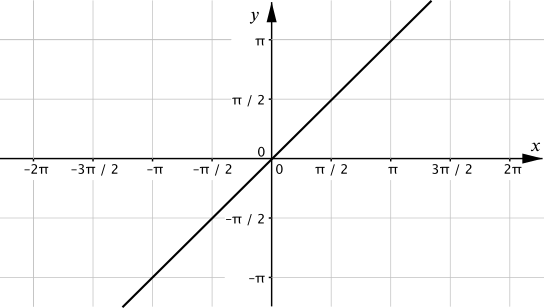
This graph shows for in the interval . Can you use it to explain why Graph C must show ?
Match these equations to the graphs below and explain your reasoning.
| Graph D | Graph E | Graph F |
|---|---|---|
| Graph G | Graph H | Graph J |
One thing I notice is that all four of the functions map to , so the graphs must pass through the origin. This eliminates Graph G.
The domain of is all real and the range is the interval . The domain of is the interval , and the principal value range is (see Inverse trigonometric functions for more explanation).
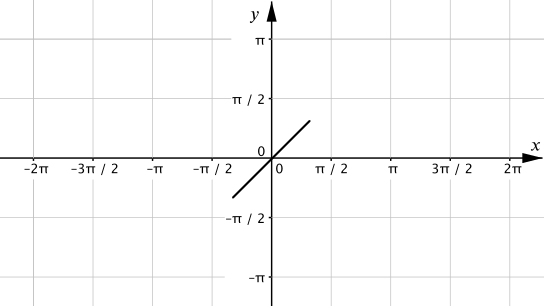
So the function is defined for all real and has range . Within the domain the function will map to itself so the graph will look like that of . So this one must be Graph D.
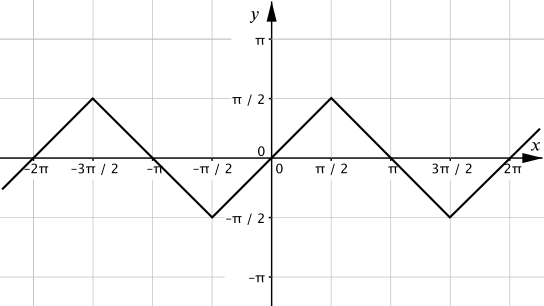
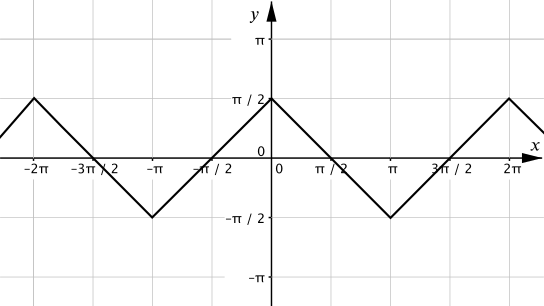
Notice that as increases from to , decreases from to and so decreases from to . And then this pattern continues, forming a zig-zag graph.
The domain of is the interval and it is undefined elsewhere. Within this domain it has range , and these values as input to produce values in the range . So the graph will look like restricted to the domain , which is Graph E.
is defined for all real and has range . is defined on the domain and its principal value range is . So the domain of this composition is all the real numbers and its range is. The only graph that matches this is J.
By way of a check, as increases from to , the value of decreases from to and so increases from to . On this domain, the graph looks like . As increases further from to , increases from to and decreases from to . Hence we get a zig-zag pattern.
is defined only for in the interval . It’s range is and of these values has range . So our graph will look like restricted to the domain , and it must be Graph E, the same as for equation (2).
It is interesting to note that and are decreasing functions on these intervals but the composition of the functions is increasing. Is this the case for any pair of decreasing functions?
As Graph C is , it must be that for all real .
Graph A shows , so only for in the interval as this is the only part of the graph for which matches the graph of .
To illustrate what happens if is outside this interval, let’s try . I know , but . Therefore . Generalising from this example, I can see that if is outside the interval and is defined, then takes to the corresponding value inside the interval .
We can draw corresponding conclusions for the and compositions by looking at graphs D, E and J.