Motion Graphs (Cambridge International A-Level Physics)
Motion graphs
- There are five types of graph that can represent motion
Distance-time graphs
-
On a distance-time graph…
- slope equals speed
- the y-intercept equals the initial position
- a straight(diagonal) line represents a constant speed
- a curved line represents an acceleration
- the slope is always zero or positive because distance is a scalar quantity
- a zero slope (horizontal line) represents a state of rest
- the area under the curve is meaningless
Displacement-time graphs
-
On a displacement-time graph…
- slope equals velocity
- the y-intercept equals the initial position
- a straight(diagonal) line represents a constant velocity
- a curved line represents an acceleration
- a positive slope represents motion in the positive direction
- a negative slope represents motion in the negative direction
- a zero slope (horizontal line) represents a state of rest
- the area under the curve is meaningless
Displacement-time graphs for different scenarios
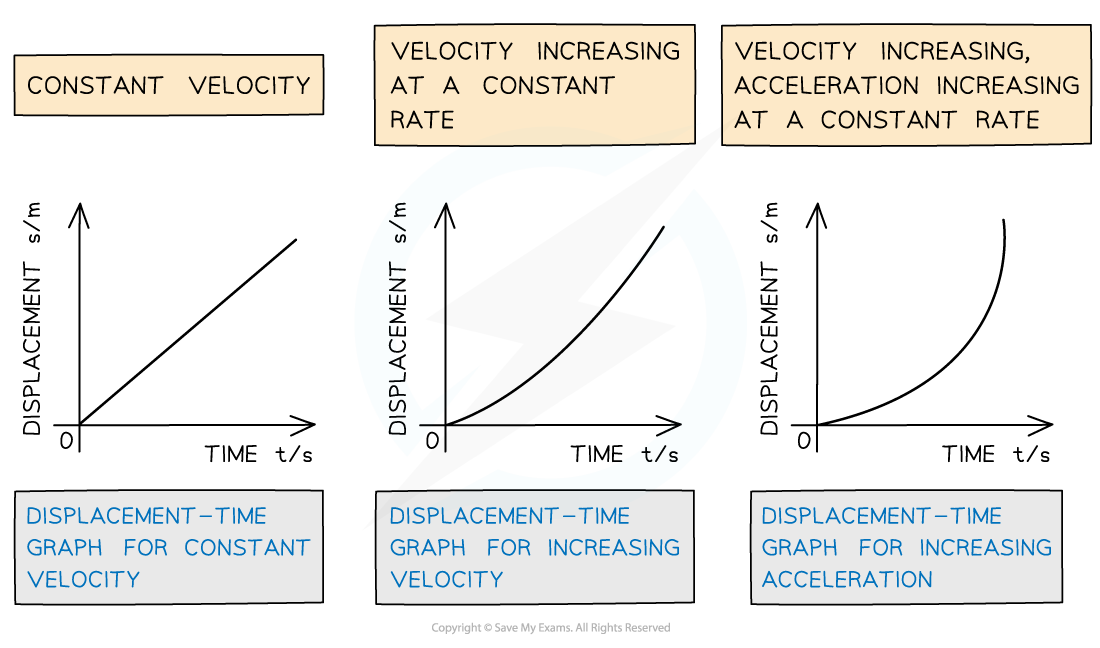
The displacement-time graph for constant velocity is a straight diagonal line, and for acceleration is a curve
Speed-time graphs
-
On a speed-time graph…
- slope equals acceleration
- the y-intercept equals the initial speed
- a straight line represents uniform acceleration
- a curved line represents non-uniform acceleration
- a positive slope represents an increase in speed
- a negative slope represents a decrease in **speed **
- a zero slope (horizontal line) represents motion with constant speed
- the area under the curve equals the** distance** travelled
Velocity-time graphs
-
On a velocity-time graph…
- slope equals acceleration
- the y-intercept equals the initial velocity
- a straight line represents uniform acceleration
- a curved line represents non-uniform acceleration
- a positive slope represents an increase in velocity in the positive direction
- a negative slope represents an increase in velocity in the negative direction
- a zero slope (horizontal line) represents motion with constant velocity
- the area under the curve equals the displacement
Velocity-time graphs for different scenarios
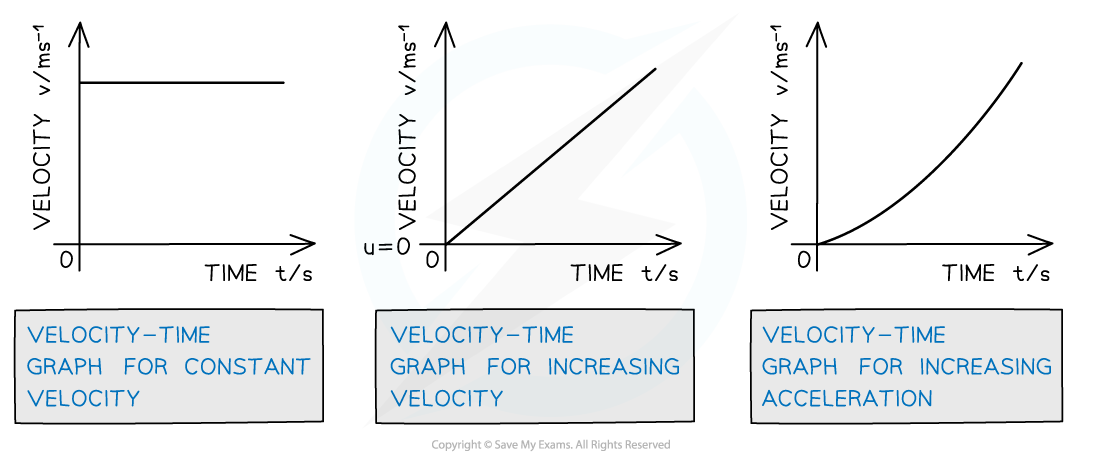
The velocity-time graph for constant velocity is a straight horizontal line, for acceleration is a straight diagonal line and for increasing acceleration is a curve
Acceleration-time graphs
-
On an acceleration-time graph…
- slope is meaningless
- the y-intercept equals the initial acceleration
- a zero slope (horizontal line) represents an object undergoing constant acceleration
- the area under the curve equals the change in velocity
Acceleration-time graph for different scenarios
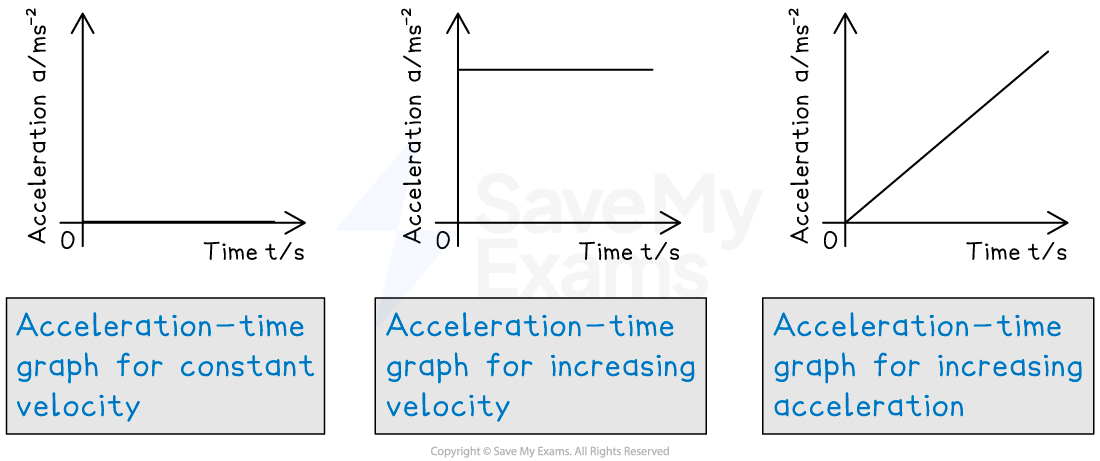
The acceleration-time graph for constant velocity is blank, for increasing velocity is a straight horizontal line and for increasing acceleration is a straight diagonal line
Exam Hint Always check the axes when dealing with graphs. The differences between distance-time graphs and displacement-time graphs, and speed-time graphs and velocity-time graphs are subtle but important. Make sure you know what you are looking at before answering any graph questions in the exam.
Was this revision note helpful?
Build on this topic