Inequalities on Graphs (Cambridge International A-Level Mathematics)
Exam board Cambridge International · A-LevelUpdated 2026-07-02
Inequalities on graphs
What are inequalities on graphs?
- Inequalities can be represented on graphs by shaded regions and dotted or solid lines
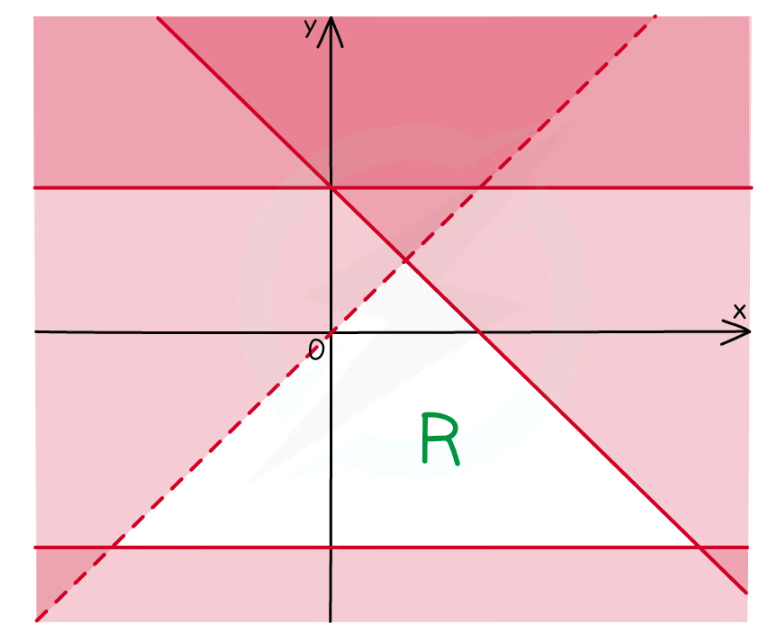
- These inequalities have two variables, x and y
- Several inequalities are used at once
- The solution is an area on a graph (often called a region)
- The inequalities can be linear or quadratic
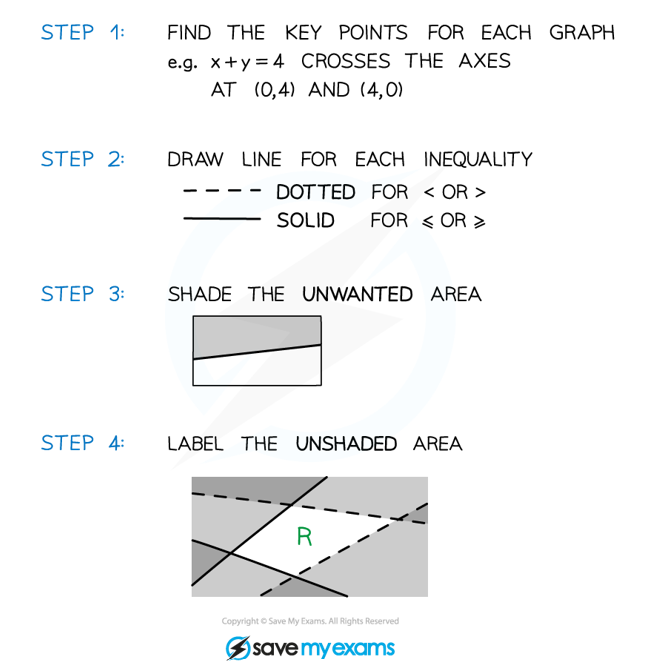
How do I draw inequalities on a graph?
-
Sketch each graph
- If the inequality is strict (< or >) then use a dotted line
- If the inequality is weak (≤ or ≥) then use a solid line
-
Decide which side of the line satisfies the inequality
-
Choose a coordinate on each side and test it in the inequality
- The origin is an easy point to use
-
If it satisfies the inequality then that whole side of the line satisfies the inequality
- For example: (0,0) satisfies the inequality y < x2 + 1 so you want the side of the curve that contains the origin
-
Exam Hint
- Recognise this type of inequality by the use of two variables
- You may have to deduce the inequalities from a given graph
- Pay careful attention to which region you are asked to shade
- Sometimes the exam could ask you to shade the region that satisfies the inequalities, this means you should shade the region that is wanted
- As long as your final answer is clear you should get the marks!
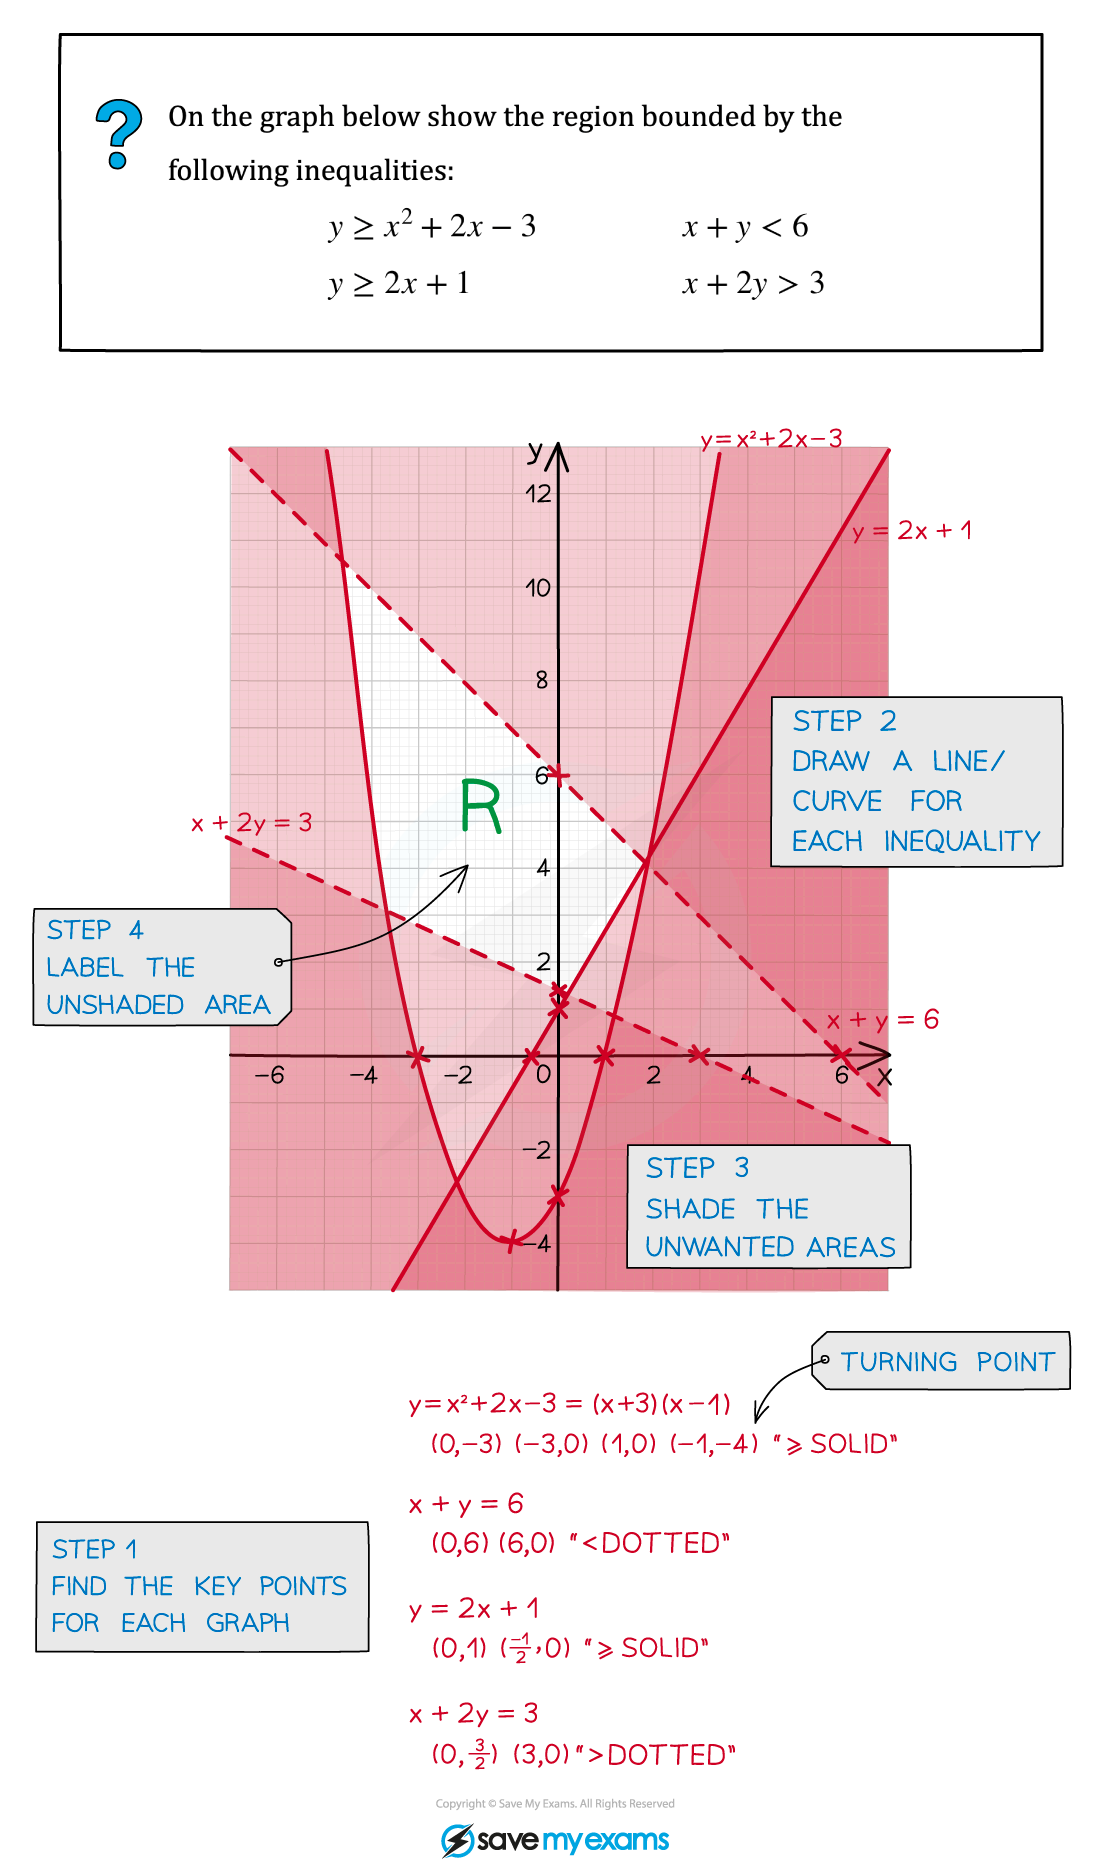
Worked Example
Was this revision note helpful?
Build on this topic