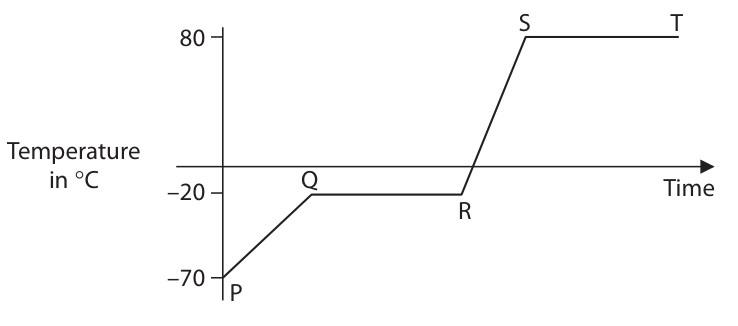
The diagram shows the temperature‑time graph for a substance which is heated at a constant rate. S T Temperature in °C –20 Q Time R –70 P
Which section of the graph shows when the substance is melting?
Choose your answer
PQ
QR
RS
ST
Which section of the graph shows when all the substance is a solid?
Choose your answer
PQ
QR
RS
ST
Draw particles in the box to show the arrangement of particles when the substance is a gas.
Which of these statements best describes the motion of particles in a gas?
Choose your answer
they vibrate about fixed points
they are stationary
they slide past each other
they move quickly and randomly
Name a piece of apparatus that could be used to measure the temperature of the substance.
Determine the boiling point of this substance. boiling point = °C
The substance has a mass of 1.2 kg. Calculate the energy required to raise the temperature of the substance from 10 °C to 37 °C. [assume specific heat capacity of substance = 840 J/kg °C] energy = J