Sound & Oscilloscopes
1 guided lesson · 9 checks · 3. Waves → Sound
Guided lessons for this note
Which concept don't you understand yet?
We'll explain it simply and check your understanding. Pick any lesson — any order works.
0 of 9 checks correct so far
Lesson 1 of 1
Displaying sound on an oscilloscope
An oscilloscope draws a picture of a rapidly changing signal against time. Feed it a microphone and a sound wave becomes a living trace: the horizontal axis is the time base, the height of the trace tracks the amplitude, and the number of complete cycles on screen tells you the frequency.
What you know already
Before the oscilloscope can time a wave for you, you have to be able to read it. This lesson builds that skill: what the microphone contributes, why a longitudinal wave gets drawn like a transverse one, and how amplitude and frequency each show up on the screen.
Key points of understanding
- An oscilloscope displays rapidly changing signals such as a sound wave or an alternating current.
- A microphone detects the sound wave and converts it into an electrical signal for the screen.
- On the screen the sound wave — longitudinal in air — is drawn with the peak-and-trough look of a transverse wave.
- The time base — the horizontal axis — is where the wave’s time period is read off.
- The trace height from the centre is related to amplitude, and more complete waves on screen means higher frequency.
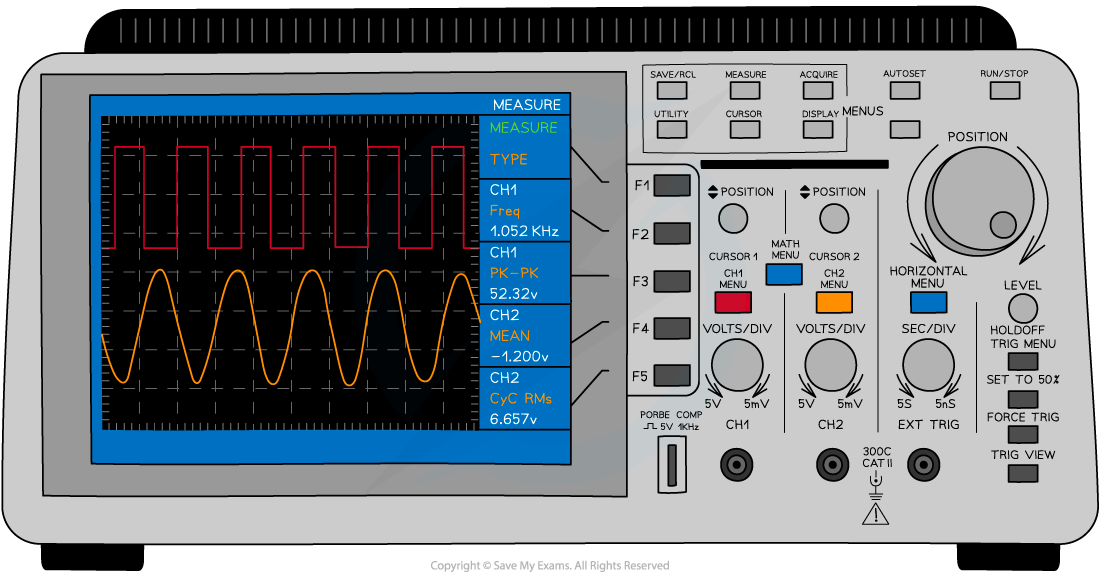
Oscilloscopes have lots of dials and buttons, but their main purpose is to display and measure changing signals like sound waves and alternating current. The horizontal axis represents time, so the two waveforms on the screen have different time periods
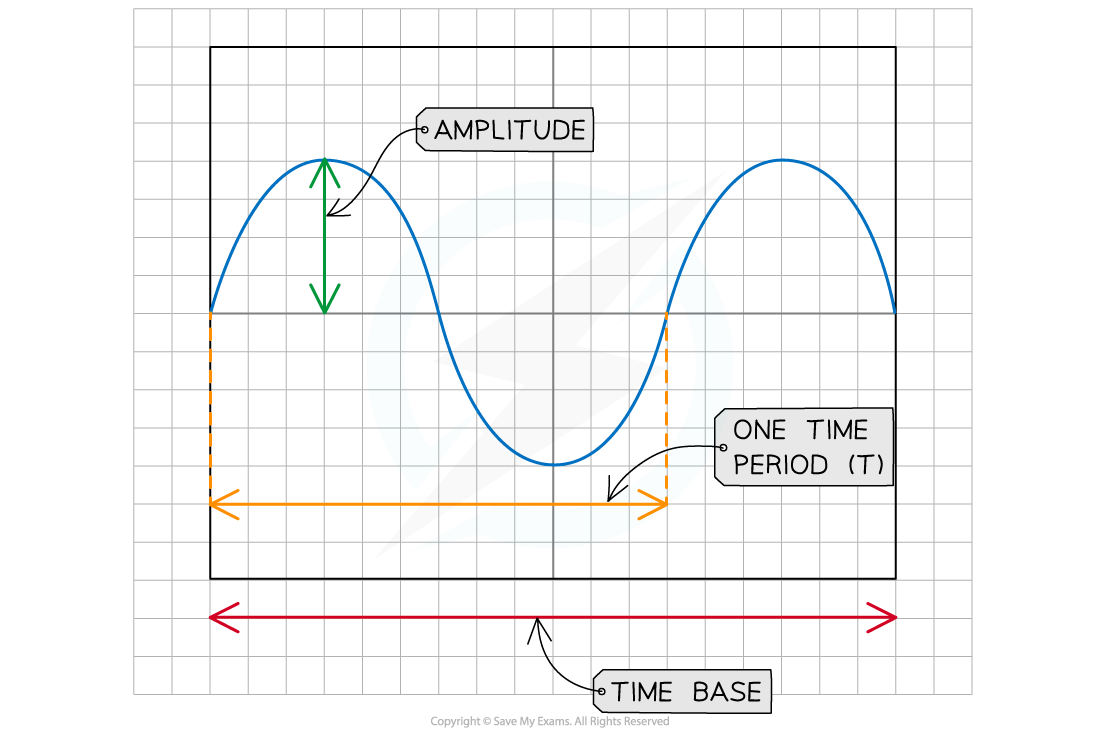
A sound wave is displayed as though it were a transverse wave on the screen of the oscilloscope. The time base can be used to measure a full time period of the wave cycle
Choose a confidence level to continue.
Prefer to read it all at once? Show the full lesson as a page
1.Displaying sound on an oscilloscope
An oscilloscope draws a picture of a rapidly changing signal against time. Feed it a microphone and a sound wave becomes a living trace: the horizontal axis is the time base, the height of the trace tracks the amplitude, and the number of complete cycles on screen tells you the frequency.
Oscilloscopes have lots of dials and buttons, but their main purpose is to display and measure changing signals like sound waves and alternating current. The horizontal axis represents time, so the two waveforms on the screen have different time periods
A sound wave is displayed as though it were a transverse wave on the screen of the oscilloscope. The time base can be used to measure a full time period of the wave cycle
Key points
- An oscilloscope displays rapidly changing signals such as a sound wave or an alternating current.
- A microphone detects the sound wave and converts it into an electrical signal for the screen.
- On the screen the sound wave — longitudinal in air — is drawn with the peak-and-trough look of a transverse wave.
- The time base — the horizontal axis — is where the wave’s time period is read off.
- The trace height from the centre is related to amplitude, and more complete waves on screen means higher frequency.
First pass
The microphone turns sound into a voltage, the oscilloscope plots that voltage against time, and the resulting wavy line can be read for amplitude through its height and frequency through how many cycles fit on the screen.
Analogy — A heart monitor for sound: each peak is one squeeze of the source, spread out along a time ruler.
Exam pointer — Say the direction trick explicitly: the sound is longitudinal in air but is DRAWN like a transverse wave because the screen plots voltage against time.
Going deeper
The microphone’s voltage rises and falls as the sound’s pressure rises and falls; plotted against time, the cycles sit side by side, so one cycle’s width is the period and the peak height from the centre line is the amplitude.
Analogy — A seismograph needle: the paper carries time horizontally while the needle swings with the push, drawing a transverse-looking picture of a shaking world.
Exam pointer — Comparisons of traces only hold while the time base is fixed — state the fixed-scale condition when comparing two notes.
Checks
0 of 9 attempted · 0 correct
Guided content from the SME authoring corpus — note rn_mr7Dpsm3T3mCqmns, pinned at 8f834fff738f · promoted SyllabAI/syllabai-resources b3caaaa90c5e