Pitch & Loudness
2 guided lessons · 18 checks · 3. Waves → Sound
Guided lessons for this note
Which concept don't you understand yet?
We'll explain it simply and check your understanding. Pick any lesson — any order works.
0 of 18 checks correct so far
Lesson 1 of 2
Pitch and the oscilloscope trace
Pitch tracks how fast a sound source vibrates. On an oscilloscope that speed becomes visible as the number of complete cycles packed across the screen, so two notes can be ranked by pitch from their traces alone, without hearing either one.
What you know already
Pitch and loudness are the two handles a listener has on any note, and both have a mechanical counterpart in the vibrating source. This note fixes the pitch-frequency pairing on the oscilloscope, the loudness-amplitude pairing beside it, and marks out the frequency window of human hearing with its infrasound and ultrasound borders.
Key points of understanding
- Pitch tracks the frequency of the vibrating source.
- High-frequency vibration gives high pitch and low-frequency vibration gives low pitch.
- On an oscilloscope, a higher-frequency note shows more complete cycles across the same screen width.
- Wider peak-to-peak spacing on the screen means fewer cycles per second, so lower pitch.
- Doubling the frequency of a note raises it by one octave.
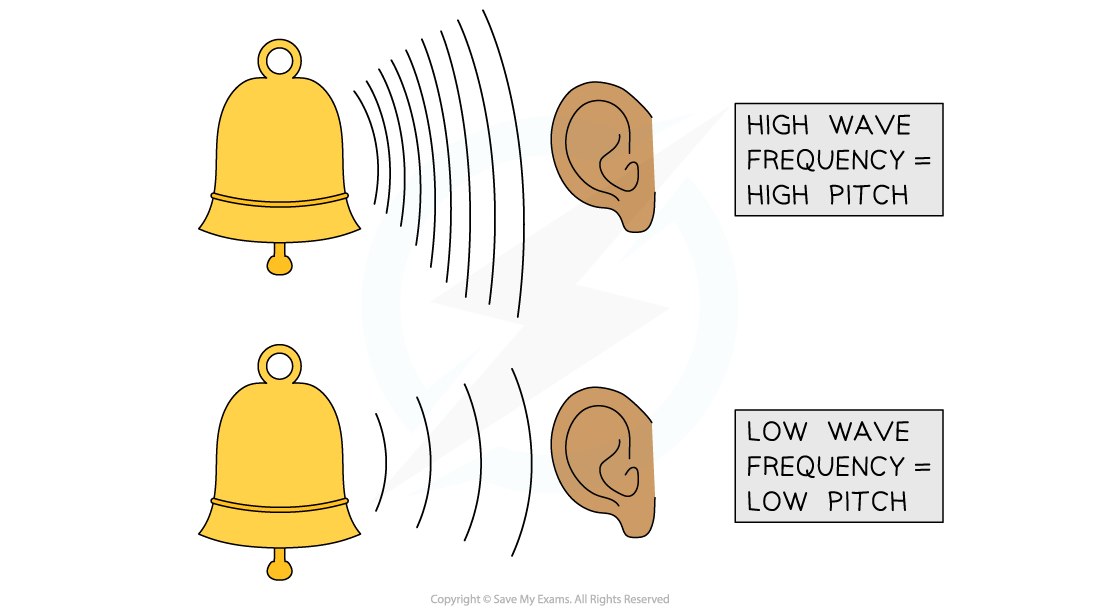
The pitch of the sound is related to the frequency of the sound waves
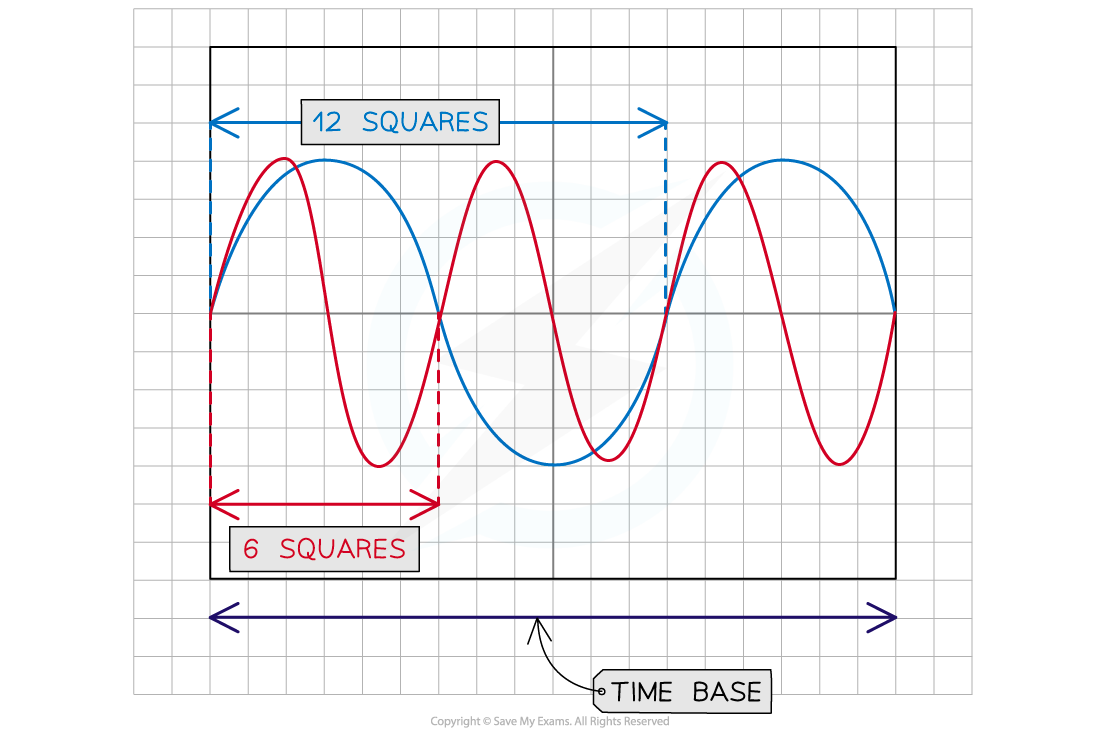
This image shows two sound waves displayed on an oscilloscope. The red wave has smaller wavelength than the blue wave hence it has higher frequency and higher pitch
Choose a confidence level to continue.
Prefer to read it all at once? Show the full lesson as a page
1.Pitch and the oscilloscope trace
Pitch tracks how fast a sound source vibrates. On an oscilloscope that speed becomes visible as the number of complete cycles packed across the screen, so two notes can be ranked by pitch from their traces alone, without hearing either one.
The pitch of the sound is related to the frequency of the sound waves
This image shows two sound waves displayed on an oscilloscope. The red wave has smaller wavelength than the blue wave hence it has higher frequency and higher pitch
Key points
- Pitch tracks the frequency of the vibrating source.
- High-frequency vibration gives high pitch and low-frequency vibration gives low pitch.
- On an oscilloscope, a higher-frequency note shows more complete cycles across the same screen width.
- Wider peak-to-peak spacing on the screen means fewer cycles per second, so lower pitch.
- Doubling the frequency of a note raises it by one octave.
First pass
Frequency sets pitch; the oscilloscope displays frequency horizontally, so more cycles across the same width is the higher-pitched note.
Analogy — A garden swing: how many full swings it makes each second is the frequency, and that count is the pitch you hear.
Exam pointer — Octave arithmetic is fair game: doubling frequency (256 → 512 Hz) is one octave up; halving is one octave down.
Going deeper
Frequency and pitch move together because the ear follows the source’s vibration rate; on screen the comparison is horizontal (cycles per width) while amplitude stays vertical, so pitch and loudness are read from the same trace without confusion.
Analogy — Two garden swings of different lengths: the shorter one completes more swings each minute, like the higher-pitched note.
Exam pointer — Octave arithmetic: doubling the frequency (256 → 512 Hz) raises the note one octave; halving lowers it one octave.
Checks
0 of 9 attempted · 0 correct
2.Loudness and the range of human hearing
Loudness tracks how far the source vibrates, and the oscilloscope shows it as trace height. Frequency itself has hard borders for the human ear: 20 Hz to 20 000 Hz, with infrasound below and ultrasound above — a sorting rule examiners love to test.
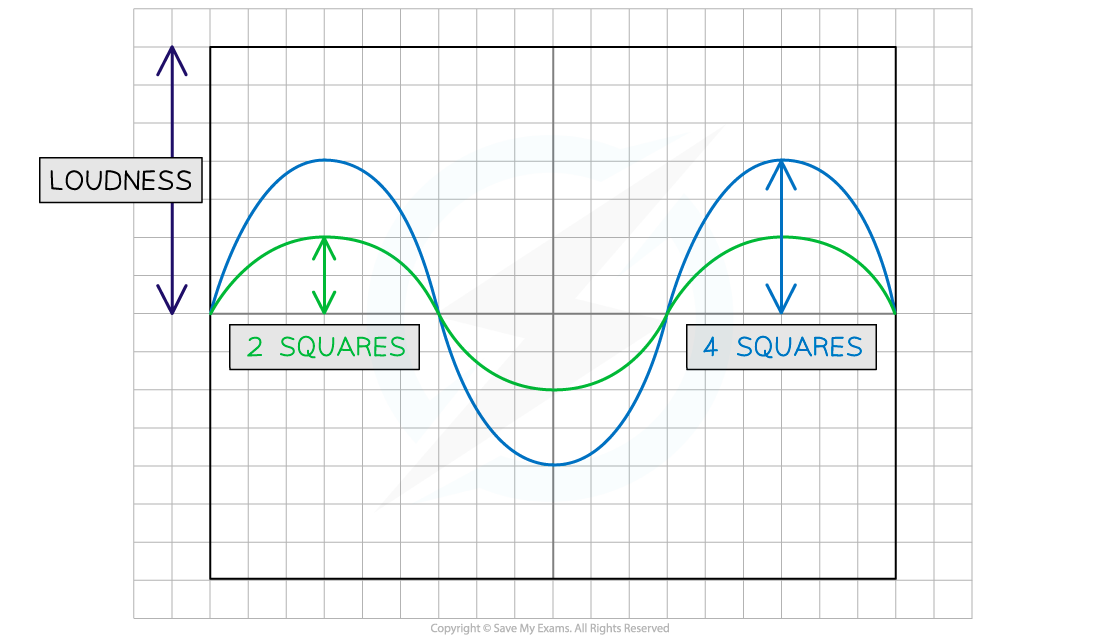
This image shows two sound waves displayed on an oscilloscope. The blue wave has twice the amplitude of the green wave because the blue wave is louder
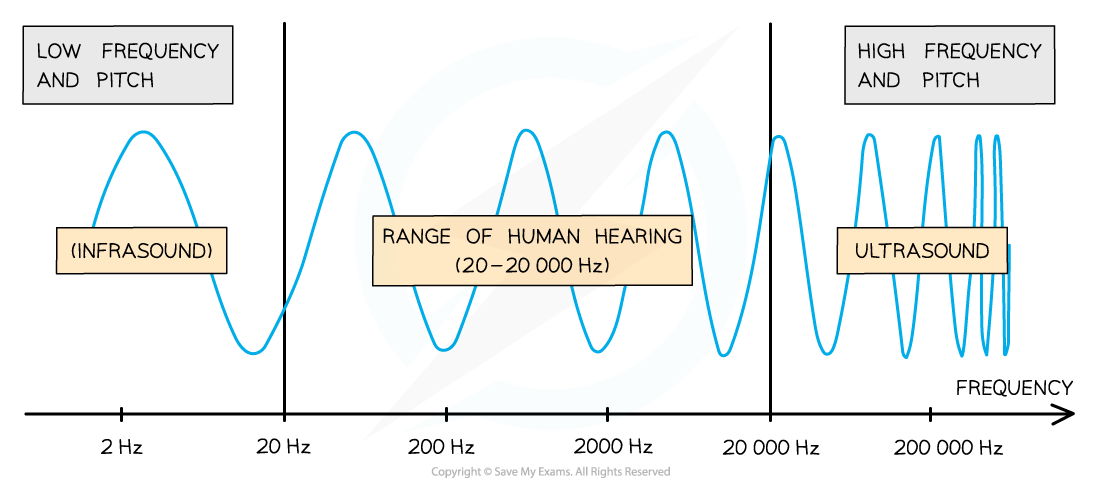
The range of human hearing is between 20 – 20 000 Hz. Below 20 Hz is known as infrasound. Above 20 000 Hz is known as ultrasound
Key points
- Loudness tracks the amplitude of the vibrating source: louder sounds swing with larger amplitude.
- On an oscilloscope, a louder note shows a taller trace measured from the centre line.
- The human ear responds to vibrations caused by sound waves.
- Human hearing spans 20 Hz to 20 000 Hz.
- Frequencies below the range are infrasound and frequencies above it are ultrasound.
First pass
Amplitude sets loudness and shows vertically on the screen; frequency has an audible window of 20 Hz to 20 000 Hz, with infrasound underneath and ultrasound above.
Analogy — A radio that only tunes between two stations: infrasound and ultrasound broadcast outside the dial, perfectly real but unheard.
Exam pointer — Quote the hearing range with units every time: 20 Hz to 20 000 Hz. Sorting a frequency into infra-, audible or ultra- is a one-mark giveaway.
Going deeper
Loudness scales with amplitude as height on the screen; the 20 Hz–20 000 Hz window then sorts every frequency into audible, infrasound (below) or ultrasound (above), independent of loudness.
Analogy — A torch beam too dim to see is still light; an ultrasound tone too high to hear is still sound — the window, not the wave, decides perception.
Exam pointer — Classification turns on the numbers: 16 Hz < 20 Hz is infrasound, 25 000 Hz > 20 000 Hz is ultrasound; quote the boundary in the answer.
Checks
0 of 9 attempted · 0 correct
Guided content from the SME authoring corpus — note rn_kTvJN82ZMcTrCypr, pinned at 8f834fff738f · promoted SyllabAI/syllabai-resources b3caaaa90c5e