IV Graphs
3 guided lessons · 27 checks · 2. Electricity → Components in Series & Parallel Circuits
Guided lessons for this note
Which concept don't you understand yet?
We'll explain it simply and check your understanding. Pick any lesson — any order works.
0 of 27 checks correct so far
Lesson 1 of 3
IV graphs
Plot the current through a component against the voltage across it and the shape of the line tells you everything. Straight through the origin: the resistance never budges. Curved away: something inside is changing. This lesson learns to read both shapes and names the components that produce them.
What you know already
How a component responds to voltage is easiest to see as a graph. A straight line through the origin means steady, predictable behaviour; a curve means the component is changing underneath you. This note reads the IV graphs of wires, filament lamps and diodes, then shows the bench setup that measures them and the resistance dial that controls them.
Key points of understanding
- An IV graph plots the current through a component against the voltage across it.
- A straight line through the origin means the relationship is linear and the resistance stays constant.
- A curved graph means the resistance changes as the current varies.
- Wires and fixed resistors at steady temperature give linear, directly proportional graphs.
- Filament lamps, diodes, LDRs and thermistors all produce non-linear graphs.
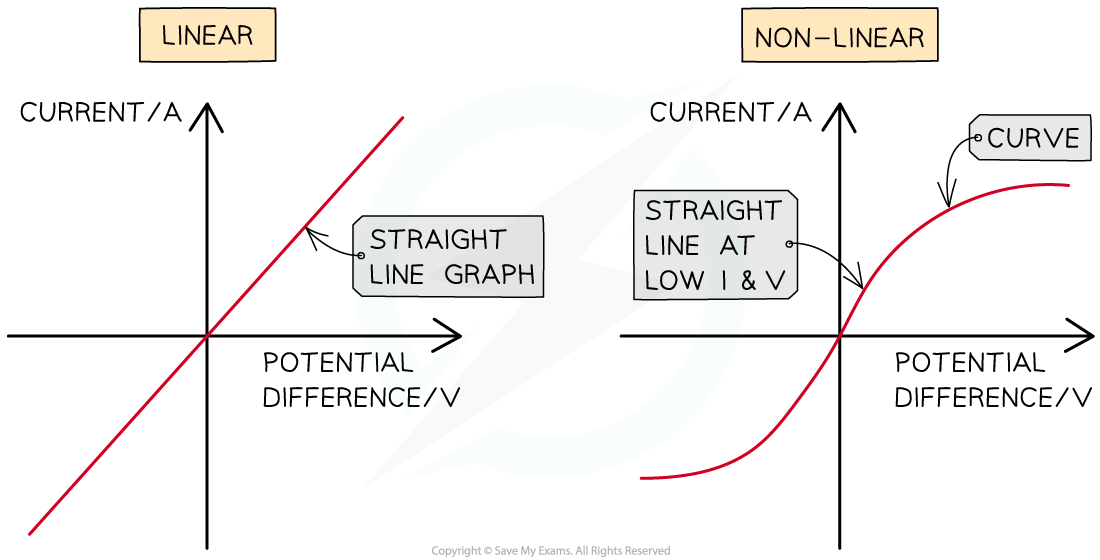
Linear IV graphs are straight lines through the origin, indicating a constant resistance. Non-linear IV graphs are curved, indicating a variable resistance
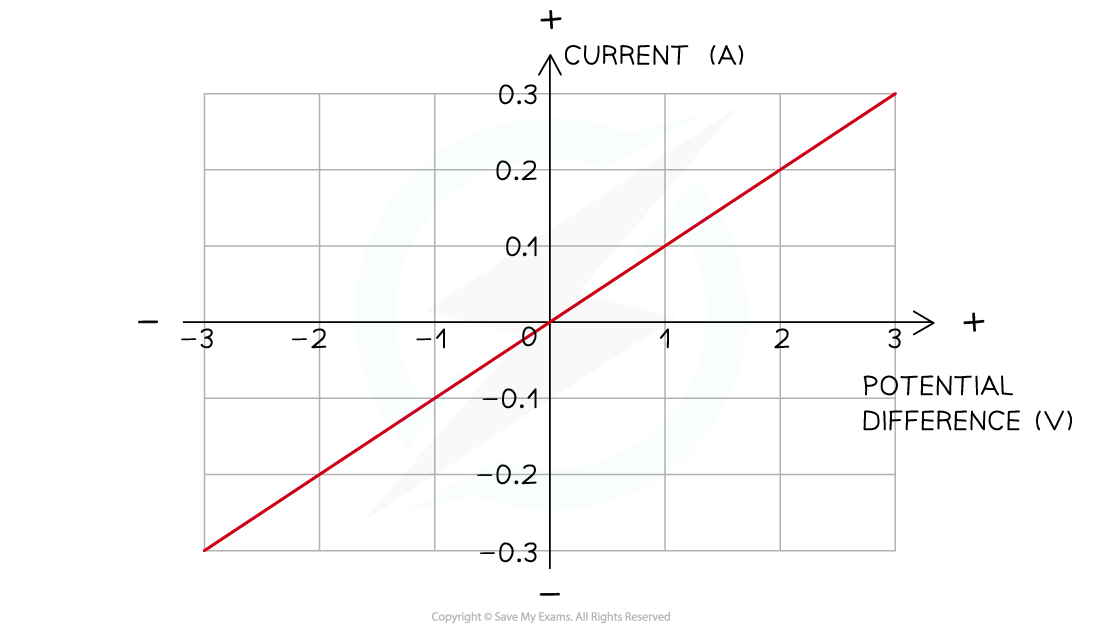
The current is directly proportional to the potential difference (voltage) as the graph is a straight line through the origin
Choose a confidence level to continue.
Prefer to read it all at once? Show the full lesson as a page
1.IV graphs
Plot the current through a component against the voltage across it and the shape of the line tells you everything. Straight through the origin: the resistance never budges. Curved away: something inside is changing. This lesson learns to read both shapes and names the components that produce them.
Linear IV graphs are straight lines through the origin, indicating a constant resistance. Non-linear IV graphs are curved, indicating a variable resistance
The current is directly proportional to the potential difference (voltage) as the graph is a straight line through the origin
Key points
- An IV graph plots the current through a component against the voltage across it.
- A straight line through the origin means the relationship is linear and the resistance stays constant.
- A curved graph means the resistance changes as the current varies.
- Wires and fixed resistors at steady temperature give linear, directly proportional graphs.
- Filament lamps, diodes, LDRs and thermistors all produce non-linear graphs.
First pass
Straight-line graph: same resistance however hard you push. Curved graph: the resistance is drifting.
Analogy — A spring scale versus a stiffening hose: one reads the same every pull, the other fights back harder the more you open it.
Exam pointer — The word 'origin' matters — a straight line that misses the origin is not the proportional case.
Going deeper
Direct proportionality means doubling one quantity doubles the other, which is exactly what a straight line through the origin encodes.
Analogy — A taxi meter with a fixed rate: twice the distance, twice the fare, forever on the same straight line.
Exam pointer — At constant temperature is the exam qualifier for a fixed resistor's line — quote it when describing the linear case.
Checks
0 of 9 attempted · 0 correct
2.IV graph for a filament bulb
Two stars of the non-linear world. The filament lamp heats itself as it works, and its own heat throttles it back. The diode is a one-way valve — generous forwards, immovable backwards. This lesson reads both graphs and the physics that shapes them.
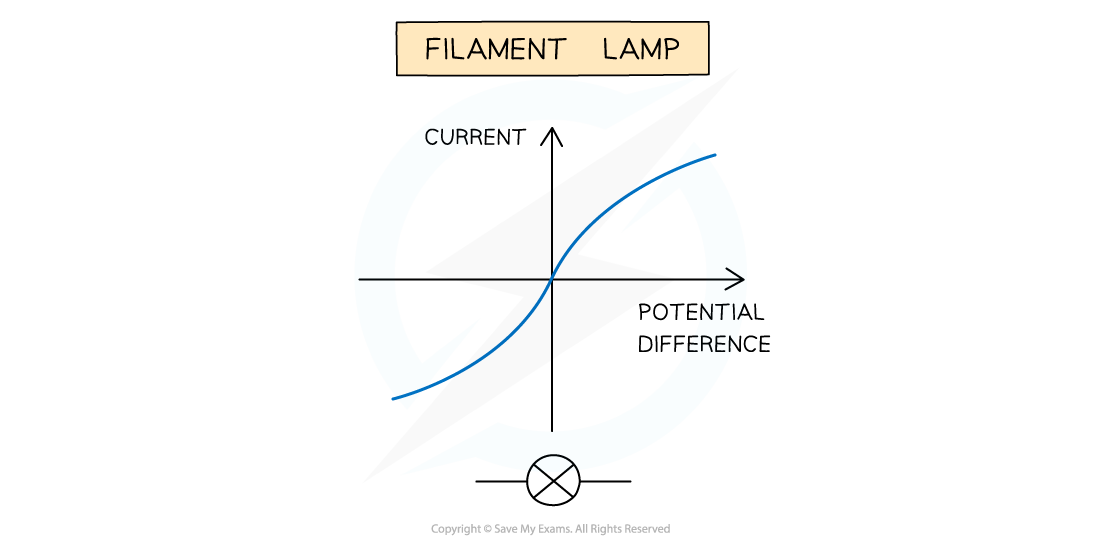
IV graph for a filament lamp
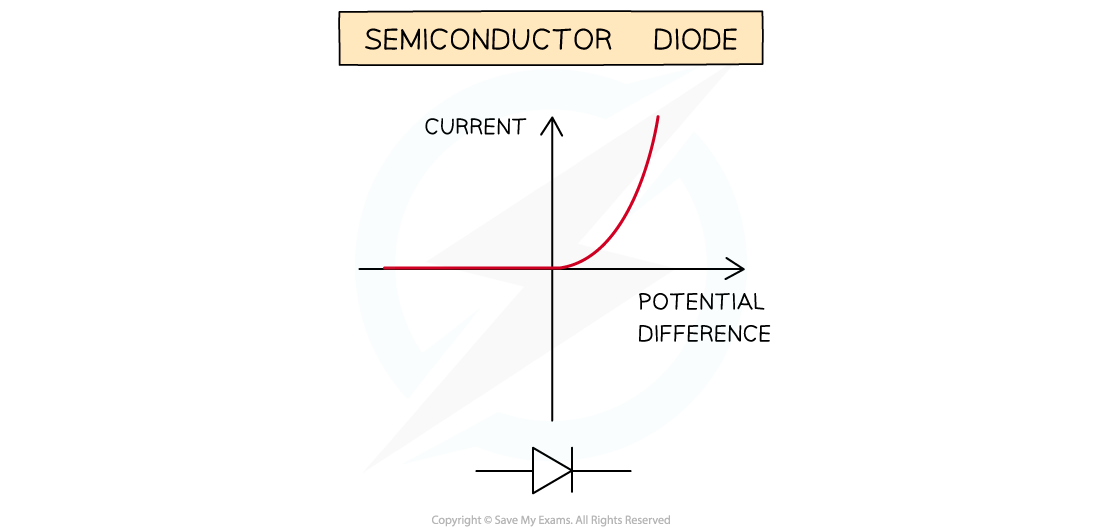
IV graph for a semiconductor diode
Key points
- A filament lamp's graph bends over: the current grows more slowly than the voltage.
- The rising current heats the filament, and hotter lattice atoms obstruct the electrons more.
- So the lamp's resistance increases as the current grows.
- A diode passes current in one direction only — the forward-bias direction.
- In reverse bias a diode's resistance is extremely high and effectively no current flows.
- On the diode's graph, forward bias shows a sharp rise on one side and reverse bias shows a flat zero region.
First pass
Lamp: the graph flattens as it warms, because heat adds resistance. Diode: current one way, blocked the other.
Analogy — The lamp is a runner tiring as they go; the diode is a turnstile that spins one way and locks the other.
Exam pointer — Name the mechanism — hot filament, vibrating atoms — not just the curve, when asked to explain the lamp's graph.
Going deeper
The lamp's slowdown is negative feedback: more current heats the filament, and the heat raises the resistance that restrains the current.
Analogy — A self-regulating door that gets heavier the harder you push it — progress continues, but always a little less easily.
Exam pointer — For non-linear graphs, resistance at a point is voltage divided by current at that point — the straight-line gradient shortcut does not apply.
Checks
0 of 9 attempted · 0 correct
3.Investigating current and voltage
Graphs do not draw themselves. Bench practice: adjust the current with a variable resistor, read the voltage off a voltmeter, and record the pairs. Step the current up, plot what you collected, and the component's IV curve appears. This lesson walks the setup and the resistance dial behind it.
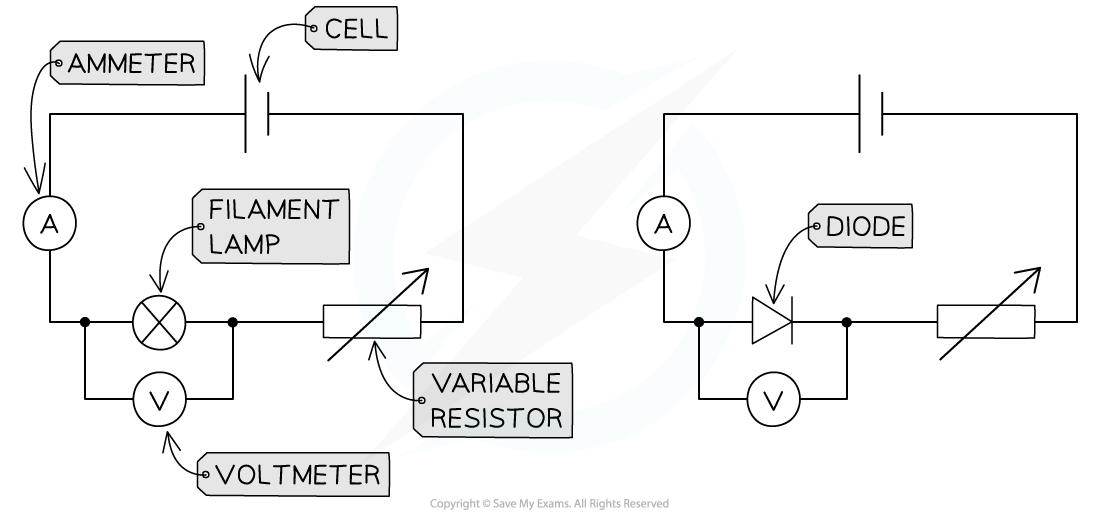
These circuits enable the investigation of current and voltage for a filament lamp or diode to be investigated

Fixed and variable resistor circuit symbols
Key points
- The investigation needs an ammeter, a voltmeter, a variable resistor, a power source and wires.
- The variable resistor adjusts the current, which is the independent variable.
- The voltmeter reads the voltage across the component — the dependent variable.
- Recording current and voltage pairs while stepping the current up yields the component's IV graph.
- A higher resistance in a circuit means a smaller current; a lower resistance means a larger one.
- Fixed resistors keep one resistance; variable resistors change theirs by altering the wire length in circuit.
First pass
Set the current with the variable resistor, read the voltage, step, repeat — the pairs plot the graph.
Analogy — Tuning a radio dial (variable resistor), noting the volume (voltage) at each setting, then plotting the response.
Exam pointer — Independent variable = what you set (current); dependent variable = what you measure (voltage). Get the labels right for the marks.
Going deeper
The variable resistor is the experiment's steering wheel: lengthening its wire raises resistance and eases the current down for the next reading.
Analogy — A dimmer slider on a lamp — slide it and the brightness steps smoothly through the range you want to record.
Exam pointer — Quote the resistance-current see-saw (higher resistance, smaller current) for the qualitative-effect part of the question.
Checks
0 of 9 attempted · 0 correct
Guided content from the SME authoring corpus — note rn_WzQZfyNNFFFFghbF, pinned at 275f3b535d78 · promoted SyllabAI/syllabai-resources b3caaaa90c5e