Core Practical: Using an Oscilloscope
1 guided lesson · 9 checks · 3. Waves → Sound
Guided lessons for this note
Which concept don't you understand yet?
We'll explain it simply and check your understanding. Pick any lesson — any order works.
0 of 9 checks correct so far
Lesson 1 of 1
Finding frequency from the time base
A tuning fork hands you a sound of pure, known-shape frequency. Display it on an oscilloscope, count the divisions spanned by one complete cycle, convert with the time-base scale to get the time period, and the frequency follows from f = 1/T — then repeat for forks of different frequency.
What you know already
This core practical turns the oscilloscope from a display into a measuring instrument. A tuning fork supplies a pure note, the time base supplies the ruler, and one counted cycle plus f = 1/T supplies the frequency — repeated across forks to map period against frequency.
Key points of understanding
- The independent variable is the frequency of the tuning fork used and the dependent variable is the measured time period.
- The microphone detects the fork’s note and the oscilloscope displays the wave electronically.
- The time base is adjusted until multiple complete waves fit on the screen.
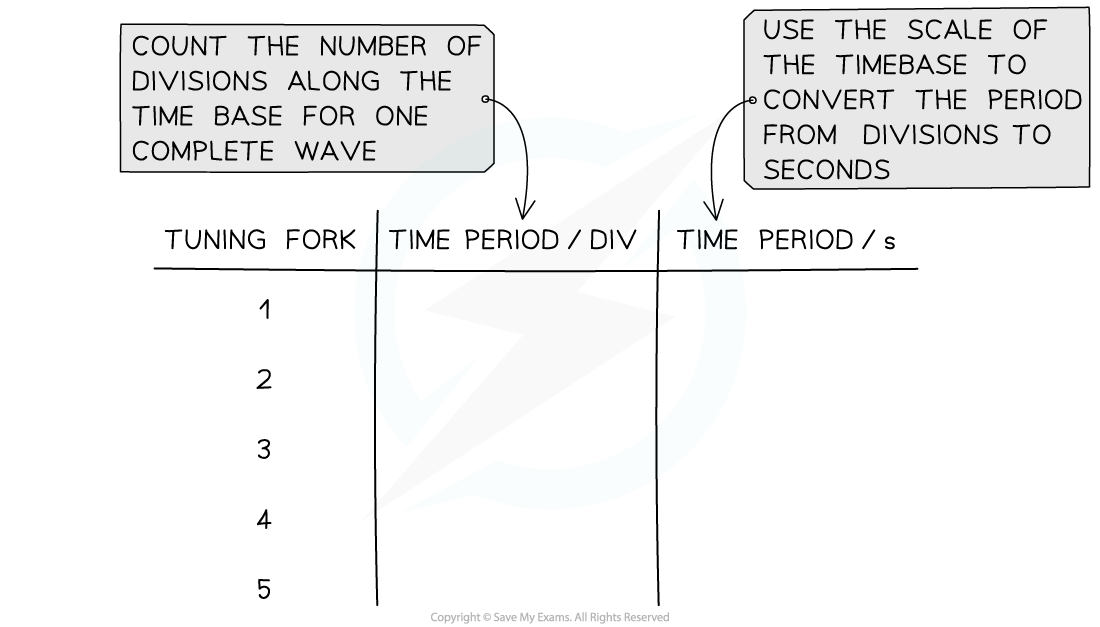
- One complete cycle is measured in divisions and converted to seconds with the time-base scale.
- Frequency is calculated from f = 1/T and the measurement is repeated for a variety of forks.
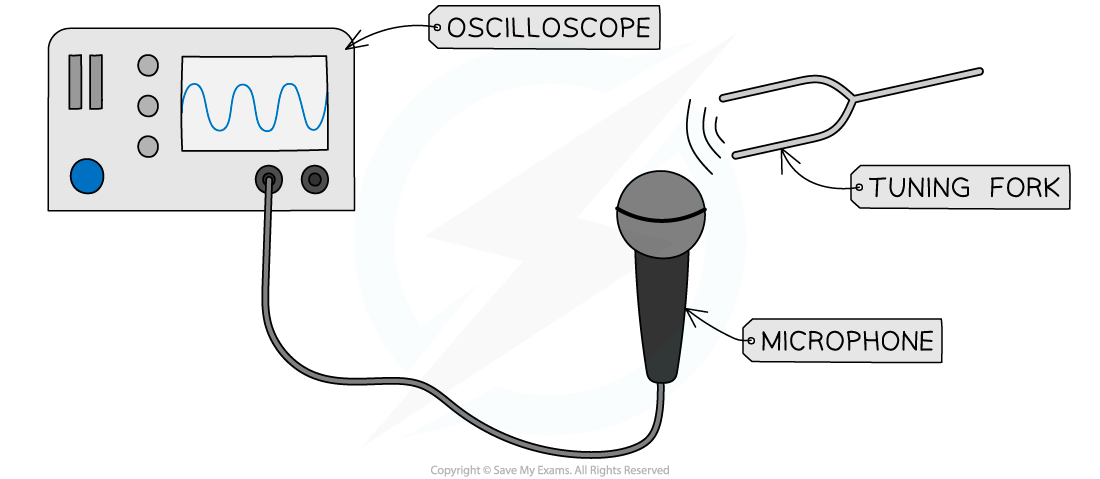
Measuring the frequency of a sound wave using an oscilloscope
Choose a confidence level to continue.
Prefer to read it all at once? Show the full lesson as a page
1.Finding frequency from the time base
A tuning fork hands you a sound of pure, known-shape frequency. Display it on an oscilloscope, count the divisions spanned by one complete cycle, convert with the time-base scale to get the time period, and the frequency follows from f = 1/T — then repeat for forks of different frequency.
Measuring the frequency of a sound wave using an oscilloscope
Key points
- The independent variable is the frequency of the tuning fork used and the dependent variable is the measured time period.
- The microphone detects the fork’s note and the oscilloscope displays the wave electronically.
- The time base is adjusted until multiple complete waves fit on the screen.
- One complete cycle is measured in divisions and converted to seconds with the time-base scale.
- Frequency is calculated from f = 1/T and the measurement is repeated for a variety of forks.
First pass
Strike a tuning fork, hold it near the microphone, freeze the trace, read the width of one cycle in divisions, convert divisions to milliseconds with the time base, and invert to get the frequency.
Analogy — Reading the wave off the screen is like timing one lap from a photo-finish: count the start and finish lines, apply the scale, and one lap gives the rate.
Exam pointer — State f = 1/T and keep the units honest: divisions × ms per division gives T in ms; convert to seconds before inverting.
Going deeper
Divisions are the scope’s ruler: counted divisions multiplied by the ms-per-division setting give the period in milliseconds, and inverting after converting to seconds gives the frequency; each fork repeats the reading to build its period-frequency pair.
Analogy — Reading a map: count centimetres on the page, multiply by the scale, and the real distance appears — here the scale is the time base.
Exam pointer — Watch the unit chain: divisions → ms → s → 1/T in Hz; slipping a factor of 1000 is the classic error.
Checks
0 of 9 attempted · 0 correct
Guided content from the SME authoring corpus — note rn_P8xWkdTw6SrvWYJx, pinned at 8f834fff738f · promoted SyllabAI/syllabai-resources b3caaaa90c5e