Core Practical: Investigating Changes of State
4 guided lessons · 36 checks · 5. Solids, Liquids and Gases → Changes of State
Guided lessons for this note
Which concept don't you understand yet?
We'll explain it simply and check your understanding. Pick any lesson — any order works.
0 of 36 checks correct so far
Lesson 1 of 4
Aim and equipment of the melting-ice practical
The investigation has one target: record how the temperature of crushed ice behaves as it is heated steadily, and reveal the plateau at the melting point. The kit list is deliberately ordinary so the plateau is not hidden by apparatus quirks.
What you know already
This practical watches ice become water on a temperature–time graph and catches the melting plateau red-handed: while the change of state runs, the thermometer refuses to move. The method, the expected flat region, and the honest error analysis are all part of the mark scheme.
Key points of understanding
- The aim is to obtain a temperature–time graph showing constant temperature while ice melts.
- Crushed ice is used so the thermometer bulb makes good thermal contact throughout the sample.
- A thermometer, a beaker, a heat source and a stopwatch form the core equipment set.
- Readings are taken at regular, equal intervals of time so the graph is fair.
Choose a confidence level to continue.
Prefer to read it all at once? Show the full lesson as a page
1.Aim and equipment of the melting-ice practical
The investigation has one target: record how the temperature of crushed ice behaves as it is heated steadily, and reveal the plateau at the melting point. The kit list is deliberately ordinary so the plateau is not hidden by apparatus quirks.
Key points
- The aim is to obtain a temperature–time graph showing constant temperature while ice melts.
- Crushed ice is used so the thermometer bulb makes good thermal contact throughout the sample.
- A thermometer, a beaker, a heat source and a stopwatch form the core equipment set.
- Readings are taken at regular, equal intervals of time so the graph is fair.
First pass
Melt some crushed ice with a gentle flame, note the temperature every half-minute, and plot temperature against time. The graph should climb, sit flat at zero degrees while the ice melts, then climb again.
Analogy — Filming a staircase where one step is a landing: the temperature climbs, rests on the melting landing for a while, then resumes climbing.
Exam pointer — Quote the aim in the question's own terms — a temperature–time graph showing the constant temperature during the change of state — rather than a vague 'find the melting point'.
Going deeper
The design manipulates the heating rate (independent variable in time) and measures temperature at fixed intervals, with crushed ice chosen to minimise thermal gradients around the bulb. The plateau is the dependent behaviour of interest: energy supplied during melting is going into the change of state, not into temperature.
Analogy — A taxi meter that stops ticking while the passenger changes seats: the engine (heater) keeps running, the fare (temperature) pauses during the transition.
Exam pointer — If asked why crushed ice rather than a single block, answer thermal contact: small chips surround the bulb so the reading reflects the whole sample, not one warm corner.
Checks
0 of 9 attempted · 0 correct
2.Method and apparatus for the melting-ice practical
The run itself is a rhythm: heat gently, stir nothing, read on the beat. Gentle heating is the whole trick — too fierce a flame smears the plateau across seconds instead of minutes.
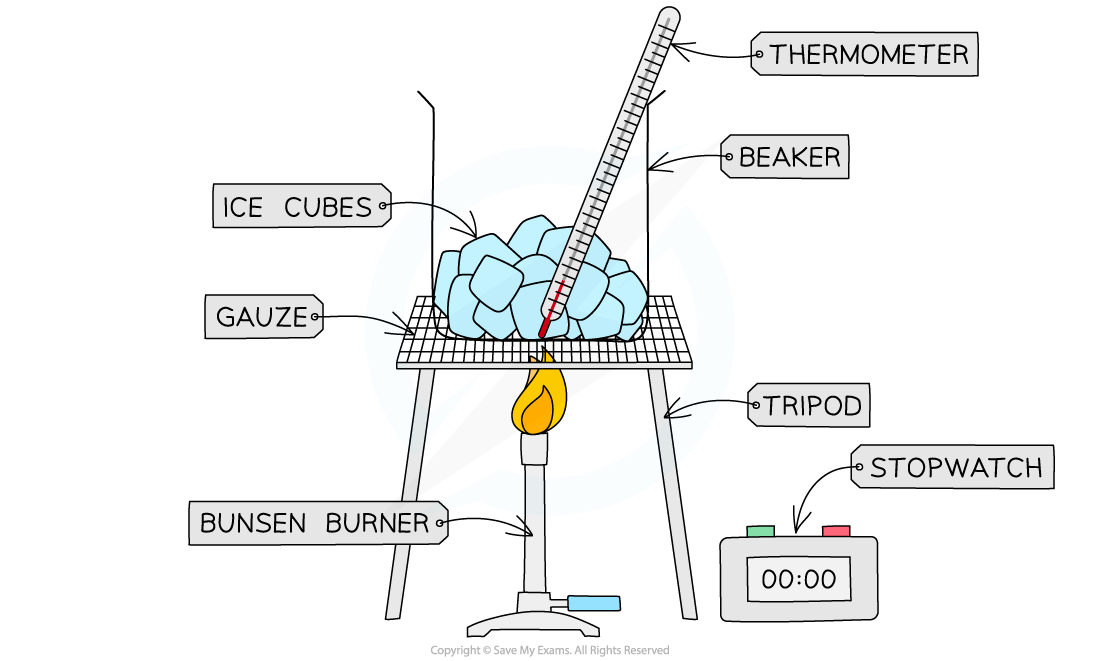
Apparatus used to heat ice and measure its temperature as it melts
Key points
- Place the thermometer bulb in the centre of the crushed ice before heating begins.
- Heat gently and steadily so the change of state is stretched out in time.
- Record the temperature at equal intervals from before melting starts until all the ice has melted.
- The apparatus is a beaker of crushed ice over a heat source with the bulb central in the sample.
First pass
Bury the bulb in the ice, light a small flame underneath, and take a temperature reading every fixed interval. Keep the flame gentle so the melting stage lasts long enough to be caught by several readings.
Analogy — Slow-roasting rather than searing: a low heat lets the cook watch every stage of the change instead of skipping past it.
Exam pointer — The words 'gentle' and 'steady' earn method marks — an uncontrolled flame is the classic reason a plateau shows only one reading.
Going deeper
The apparatus couples a low, steady heating rate to fixed-interval sampling so that the isothermal melt occupies a measurable stretch of the time axis. Starting readings before heating establishes the initial state, and continuing past full melt shows the resumed temperature rise — both anchor the plateau between two climbing limbs.
Analogy — A slow-motion replay of a sprint finish: only by slowing the action (gentle heating) can the judge (thermometer) log each frame (reading) of the decisive moment.
Exam pointer — Describe readings taken before, during and after the melt — the plateau is only convincing if the graph rises, flattens, then rises again.
Checks
0 of 9 attempted · 0 correct
3.Results and the analysis of the melting curve
The numbers become a table, the table becomes a curve, and the curve confesses: temperature climbs, refuses to move through the melt, then climbs again. The flat stretch is the energy of change of state made visible.
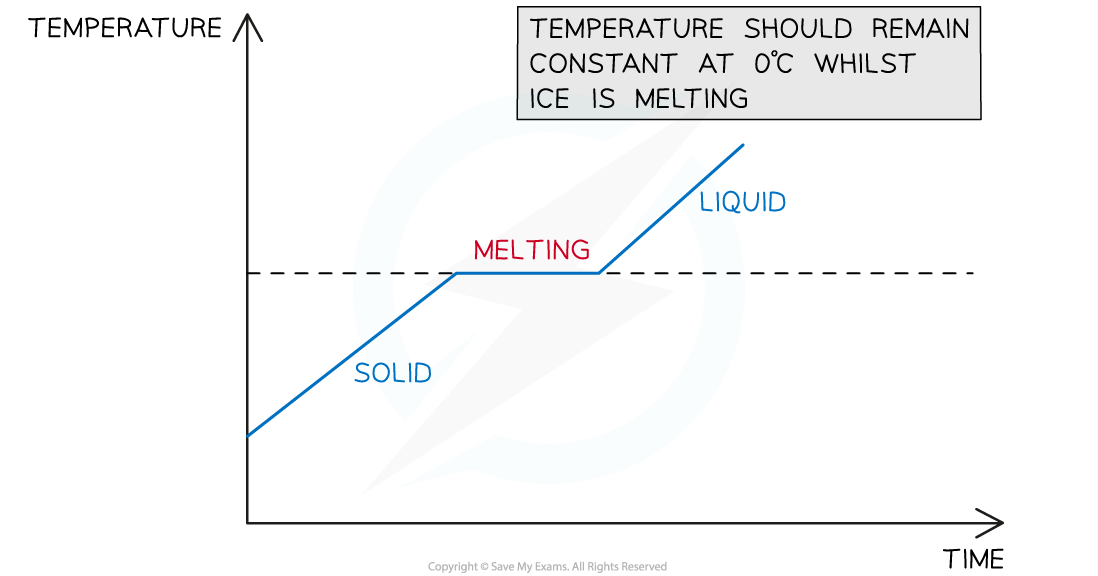
A graph of temperature against time will show a flat region where the ice is melting
Key points
- Readings are tabulated as time against temperature at the fixed sampling interval.
- Plotting temperature against time reveals a flat region at the melting point.
- The flat region shows energy supplied during melting is not raising the temperature.
- After the last ice melts, the temperature of the liquid water rises again.
First pass
Write each reading in the table, plot it, and look for the horizontal step. That step sits at zero degrees for melting ice and proves the temperature held constant while the state changed.
Analogy — A heartbeat trace with a flat pause: the pulse (heating) never stopped, but the trace held its line through the pause.
Exam pointer — When asked to 'use the graph', point at the flat region by name and read its temperature off the axis — that pairing is the analysis mark.
Going deeper
During the plateau the supplied energy raises the internal energy of the sample by weakening intermolecular attractions rather than by speeding particles up, so the mean kinetic energy — and hence the temperature — is unchanged. The gradient before and after the plateau reflects the specific heat capacities of ice and water respectively, which differ, so the two limbs need not be parallel.
Analogy — Paying workers to unbolt seats instead of pushing the rows faster: the money (energy) is spent, the seating chart (state) changes, but the row speed (temperature) pauses.
Exam pointer — If asked why the two rising limbs have different slopes, answer that ice and water have different specific heat capacities — equal heating raises their temperatures at different rates.
Checks
0 of 9 attempted · 0 correct
4.Evaluating the melt-curve practical and working safely
No practical is perfect: heat leaks, readings wobble, bulbs touch glass. Naming the systematic and random errors — and the fixes — is as much a part of the practical as the plateau itself.
Key points
- A systematic error such as heat bypassing the ice tilts or shortens the plateau.
- Random reading errors are reduced by averaging and by careful, consistent reading technique.
- The main safety duties are handling the hot beaker with tongs or a heatproof mat and keeping the flame controlled.
- Eye protection is worn throughout because heated glassware can spit or crack.
First pass
Watch out for heat sneaking straight into the thermometer or beaker rather than the ice, and for small wobbly readings. Use goggles, stand the hot beaker on a mat, and lift it with tongs.
Analogy — Checking a cake recipe: note where heat escaped, accept that every timing jitters a little, and keep the oven gloves on.
Exam pointer — Classify before you fix: systematic errors shift every reading the same way, random errors scatter — improvements should match the error type.
Going deeper
The dominant systematic threat is energy entering the bulb or glass rather than the sample, which lifts the apparent melt temperature; the control is insulating or repositioning the bulb. Random scatter comes from parallax and reaction-time variation between interval readings; repeating the run and smoothing the plot mitigates it. Safety mirrors any small-scale heating practical: eye protection, heatproof mat, tongs, and flame discipline.
Analogy — Calibrating bathroom scales on a tilted floor: no amount of re-weighing (averaging) fixes a tilt (systematic), but the jitter between steps (random) does average out.
Exam pointer — For the evaluation mark, name the error, name its effect on the plateau, and name the fix — all three, in that order.
Checks
0 of 9 attempted · 0 correct
Guided content from the SME authoring corpus — note rn_F4DQN5PJR8qD7dbw, pinned at 8788fc85a2c1 · promoted SyllabAI/syllabai-resources b3caaaa90c5e