Velocity-Time Graphs
2 guided lessons · 18 checks · 1. Forces & Motion → Movement & Position
Guided lessons for this note
Which concept don't you understand yet?
We'll explain it simply and check your understanding. Pick any lesson — any order works.
0 of 18 checks correct so far
Lesson 1 of 2
Reading slopes and flats on a velocity-time graph
On this graph the story is told entirely by the line's direction and steepness: rising means gaining speed, falling means losing it, and a flat stretch means cruising unchanged. This lesson builds the full reading vocabulary before any numbers are taken from the plot.
What you know already
The distance-time graph answered 'how far by when'; the velocity-time graph answers the sharper question of how the pace itself evolved. This lesson teaches the graph's vocabulary of slopes and flats, then extracts a number from the picture by measuring its gradient.
Key points of understanding
- A velocity-time graph plots the object's velocity against time, so the vertical axis carries m/s and the horizontal axis carries seconds.
- A straight sloping line means the acceleration is constant for that whole stretch.
- The steepness of the slope carries the size of the acceleration: steep means fast-changing, gentle means gradual.
- A positive gradient shows the velocity increasing; a negative gradient shows it decreasing.
- A flat horizontal line means zero acceleration, which is motion at a steady velocity.
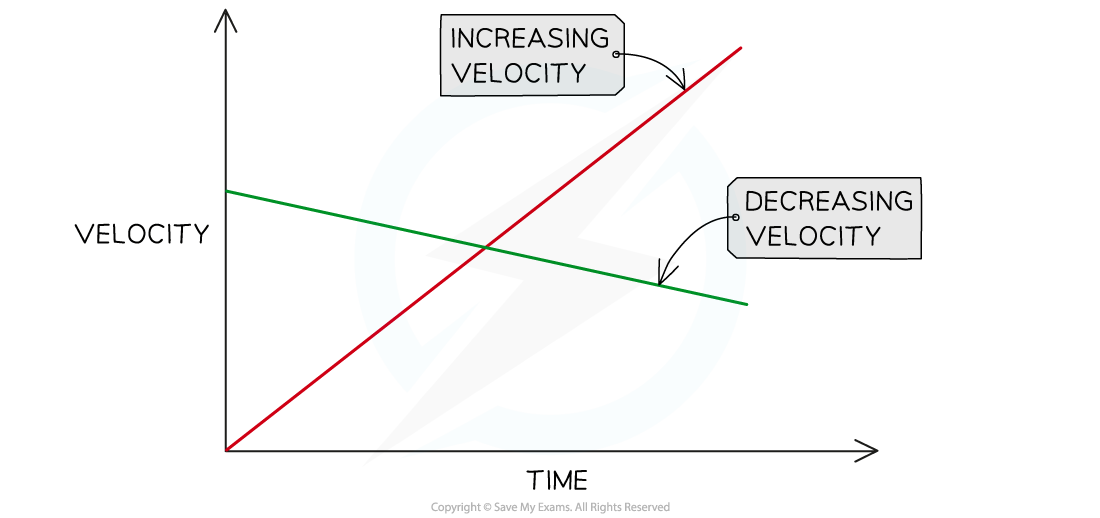
Increasing and decreasing velocity represented on a velocity-time graph
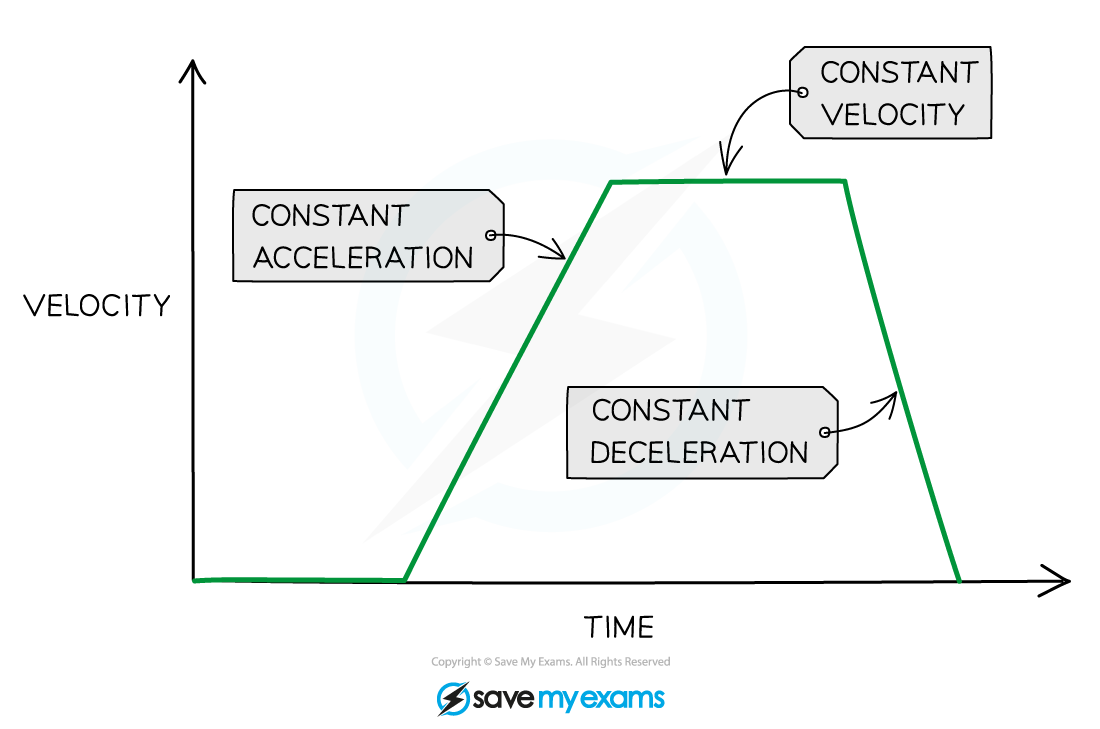
Flat horizontal lines on a velocity-time graph show periods of constant velocity, and sloping straight line show periods of acceleration
Choose a confidence level to continue.
Prefer to read it all at once? Show the full lesson as a page
1.Reading slopes and flats on a velocity-time graph
On this graph the story is told entirely by the line's direction and steepness: rising means gaining speed, falling means losing it, and a flat stretch means cruising unchanged. This lesson builds the full reading vocabulary before any numbers are taken from the plot.
Increasing and decreasing velocity represented on a velocity-time graph
Flat horizontal lines on a velocity-time graph show periods of constant velocity, and sloping straight line show periods of acceleration
Key points
- A velocity-time graph plots the object's velocity against time, so the vertical axis carries m/s and the horizontal axis carries seconds.
- A straight sloping line means the acceleration is constant for that whole stretch.
- The steepness of the slope carries the size of the acceleration: steep means fast-changing, gentle means gradual.
- A positive gradient shows the velocity increasing; a negative gradient shows it decreasing.
- A flat horizontal line means zero acceleration, which is motion at a steady velocity.
First pass
Look at which way the line tilts: up means the object gains speed, down means it loses speed, and level means the speed holds steady. How steep the tilt is tells you how quickly the speed changes.
Analogy — Picture a hiking trail map where height is the speed: climbing stretches gain speed, descending stretches lose it, and the flat plateaus cruise.
Exam pointer — Describe sections with the motion word first (accelerating, decelerating, constant velocity), then justify it from the slope's tilt.
Going deeper
Because the vertical axis is velocity, the gradient of the line is the acceleration. A single straight section therefore has one constant acceleration across it, and only a bend between sections changes the acceleration's value.
Analogy — The line behaves like a car's accelerator pedal held at one setting: the slope is the pedal pressure, and a new section is a new pedal setting.
Exam pointer — Two-line comparison questions are decided by steepness alone: the steeper line carries the larger acceleration even if it sits lower on the graph.
Checks
0 of 9 attempted · 0 correct
2.Acceleration from the gradient
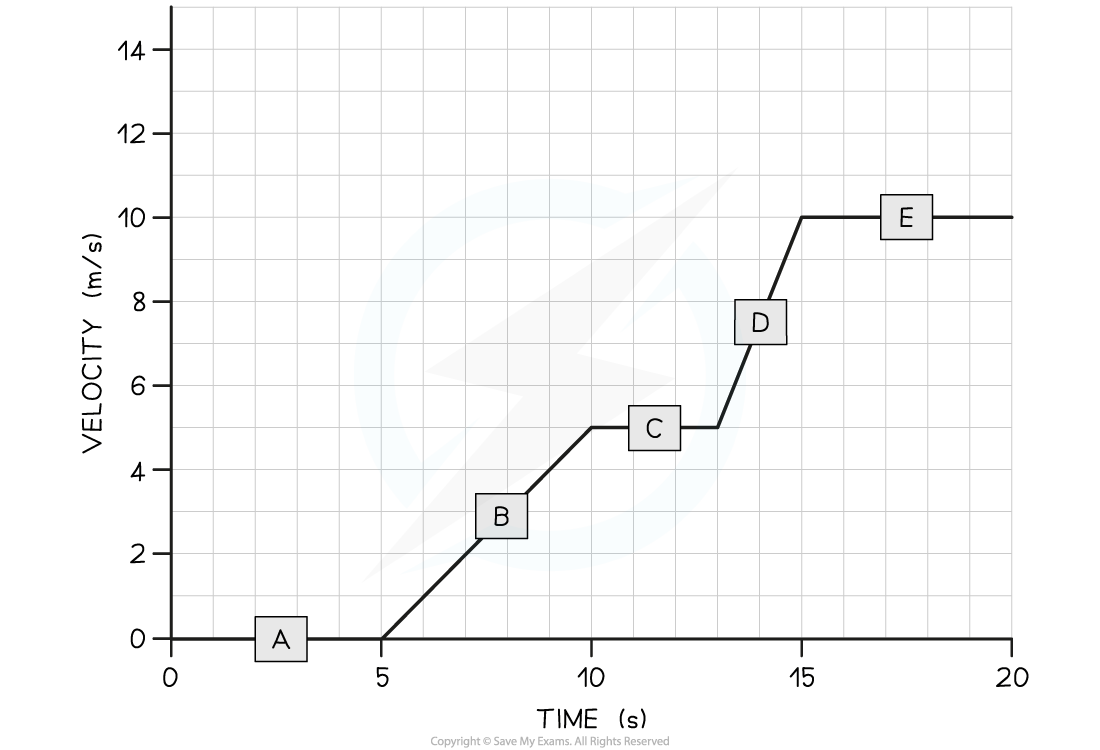
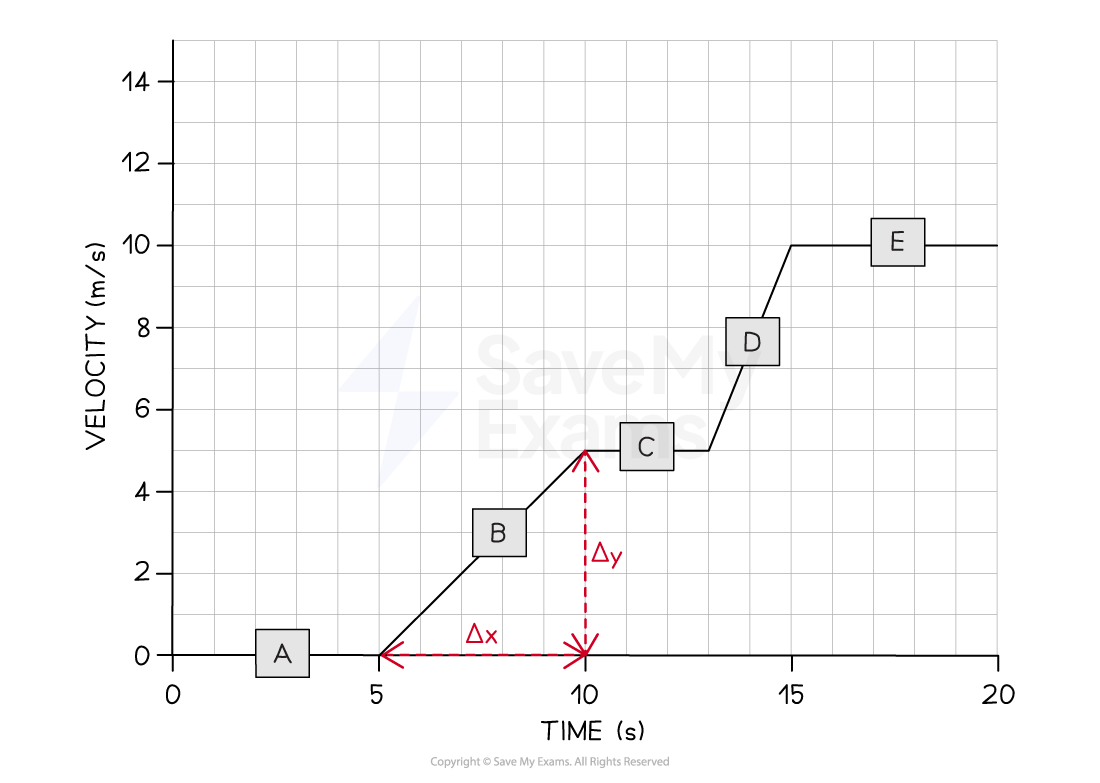
The picture now becomes a calculator. Because the vertical axis is velocity, the gradient of any straight section is numerically the acceleration, and a large, clearly-drawn gradient triangle turns the reading into a mark-earning calculation. This lesson drills that extraction on the cyclist's training graph.
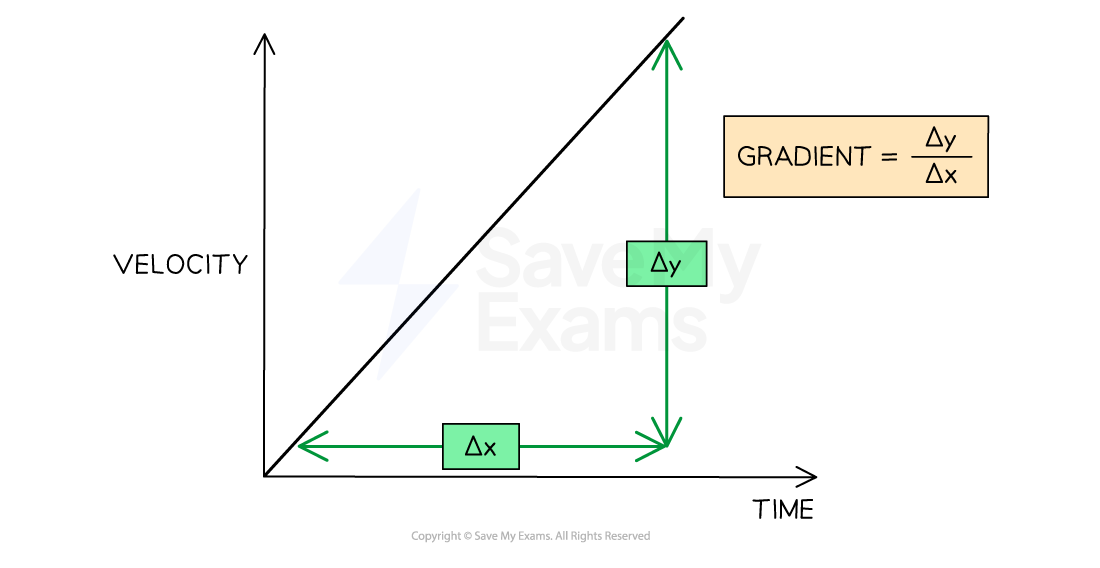
How to find the gradient of a velocity-time graph
Key points
- The acceleration equals the gradient of the velocity-time line: acceleration = gradient = Δy / Δx.
- Δy is the change in velocity read off the vertical axis; Δx is the matching change in time from the horizontal axis.
- Draw the gradient triangle as large as the section allows, and take both changes straight from the axis scales with their units.
- The worked reading for the cyclist between 5 s and 10 s: Δv = 5 m/s over Δt = 5 s, giving a = 1 m/s².
First pass
Pick the straight section, draw a big right-triangle under it, then divide how much the velocity rose by how long the rise took. That quotient is the acceleration.
Analogy — It is exactly like reading a road's steepness sign: rise over run, except the rise is a speed and the run is a time.
Exam pointer — Examiners award credit for a large gradient triangle drawn ON the graph; a tiny triangle squeezed between gridlines invites reading error.
Going deeper
Gradient extraction is the graphical twin of a = Δv/t: Δy plays Δv, Δx plays t. The section's straightness is what makes one number describe the whole interval.
Analogy — A single gradient number summarises the section the way one average summarises a whole trip: lawful precisely because the line is straight.
Exam pointer — State the unit with the answer: a gradient read as (5 m/s)/(5 s) is 1 m/s², never a bare 1.
Checks
0 of 9 attempted · 0 correct
Guided content from the SME authoring corpus — note rn_5hfYYFrc2XjMJCrq, pinned at aa6485187429 · promoted SyllabAI/syllabai-resources b3caaaa90c5e