14 marks
Solve the simultaneous equations 3 x 5 y 7.5 7 x 6 y 3.9 Show clear algebraic working.
11 questions · 100 marks · ≈ 2 hours
Calculator allowed · Answer all questions · Show all your working
Solve the simultaneous equations 3 x 5 y 7.5 7 x 6 y 3.9 Show clear algebraic working.
The line L with equation y 2 x 2 is drawn on the grid opposite.
On the grid opposite, draw the graph with equation x y for values of x from −4 to 6
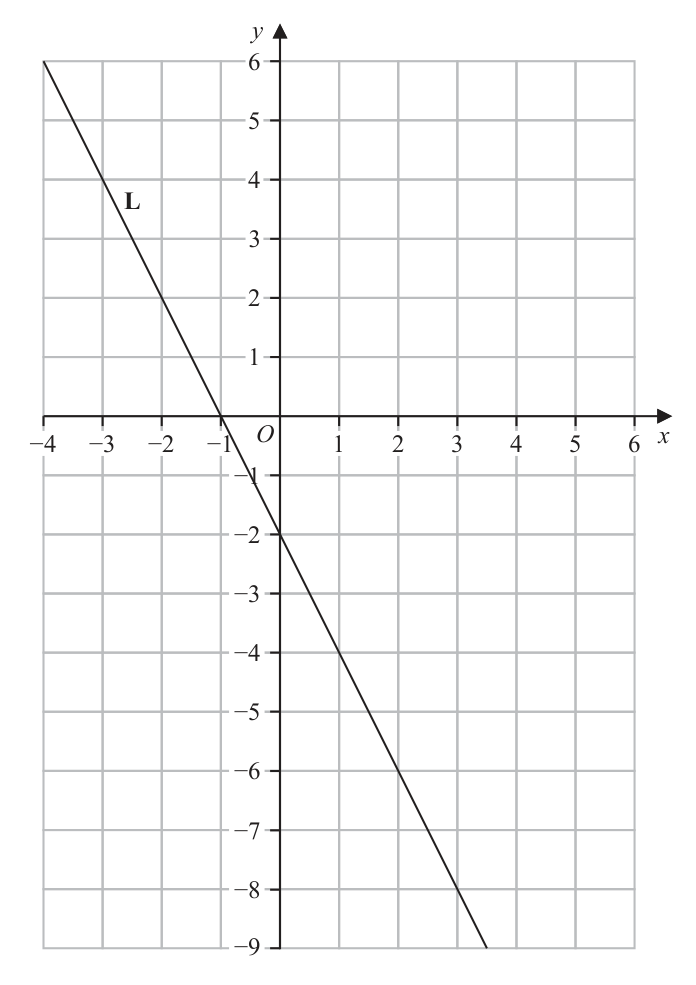
On the grid opposite, draw the graph with equation 3 y x for values of x from −4 to 6
Show, by shading on the grid opposite, the region R defined by all of the inequalities x − y ≤ 4 y ≥ −2 x − 2 3 y x ≤ Label the region R The point P with coordinates (x, y) lies in the region R Given that y is an integer and P lies on the line with equation x = 1
write down all the possible y coordinates of the point P y L −4 −3 −2 −1 O 1 2 3 4 5 6 x −1 −2 −3 −4 −5 −6 −7 −8 −9
E = {2, 3, 4, 5, 6, 7, 8, 9, 10} P = {prime numbers} E = {even numbers} F = {factors of 36}
E ′
P F
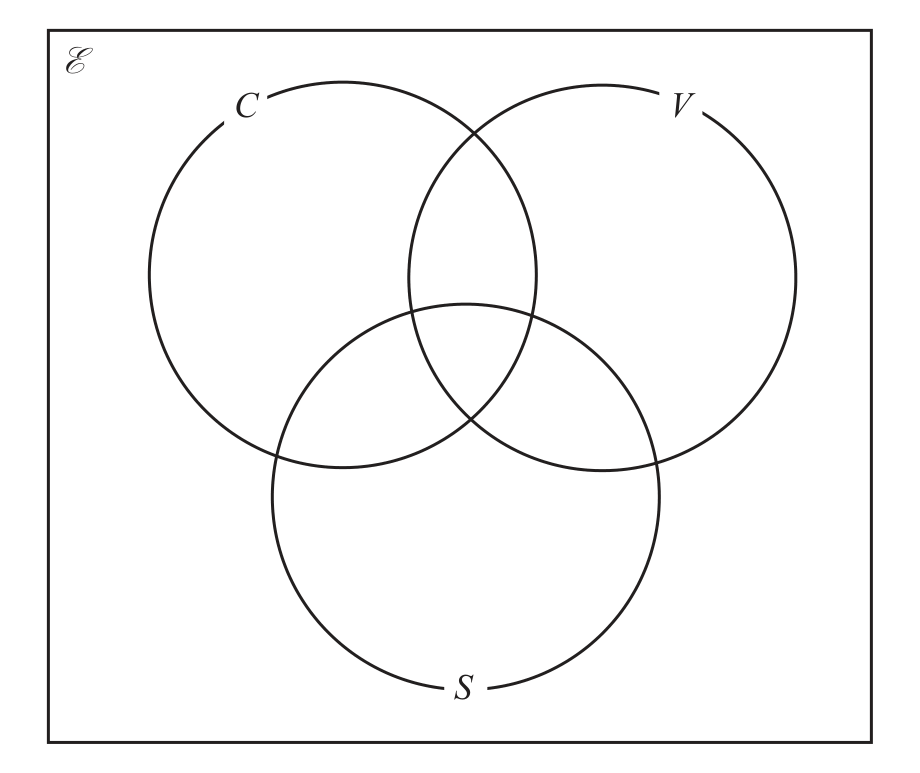
E ∪ F 70 children were asked which flavours of ice cream they like from chocolate (C), vanilla (V) and strawberry (S). 5 children like chocolate and vanilla and strawberry 15 like strawberry only 12 like chocolate only 8 like none of the flavours 6 like strawberry and vanilla 11 like chocolate and vanilla 21 like strawberry 35 like vanilla
Show all of this information on the Venn diagram opposite, giving the number of students in each appropriate subset.
n(C )
n C V S One of the 70 children is chosen at random. Given that this child likes vanilla
find the probability that this child also likes chocolate. E C V S
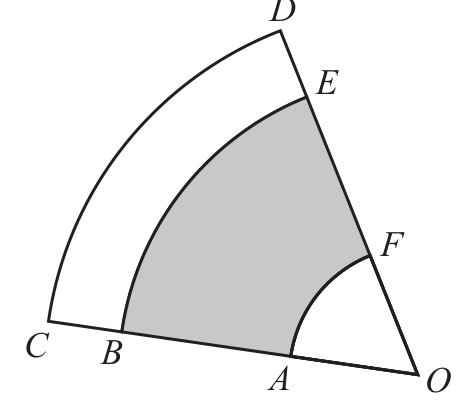
D Diagram NOT E accurately drawn F C B A O Figure 1 Figure 1 shows 3 sectors, OAF, OBE and OCD The three sectors have the same centre O OABC and OFED are straight lines. DOC and OD = 6.6 cm
Calculate the length, in cm to 3 significant figures, of the arc CD The area of the shaded region ABEF is of the area of sector OCD
Calculate the area, in cm² to 3 significant figures, of the shaded region ABEF Given that OA = 1.1 cm
calculate the length, in cm, of AB
A bag contains 8 red counters and 5 blue counters only. Imran takes at random 2 counters from the bag.
Calculate the probability that these 2 counters are the same colour. A box contains 11 black counters and w white counters only. Nathalie takes at random 2 counters from the box. The probability that these 2 counters are both white is
Calculate the value of w Show all your working.
Diagram NOT accurately drawn h cm r cm Figure 2 Figure 2 shows a solid shape S, made by fixing a solid right circular cone to the flat circular face of a solid hemisphere. The centre of the base of the cone coincides with the centre of the hemisphere. The base radius of the cone and the radius of the hemisphere are each r cm The height of the cone is h cm The total volume of S is 1660 cm³ the volume of the hemisphere : the total volume of S = 8 : 25
Find, in cm to 3 significant figures, the value of r
Find, in cm to 3 significant figures, the value of h 1 2 Volume of cone 3 r h Volume of sphere 4 r 3
B Diagram NOT accurately drawn A a O 2b C Figure 3 Figure 3 shows quadrilateral OABC = a 3b a = 2b The point D lies on OB such that =
Find a simplified expression for in terms of a and b The point E lies on such that =k Given that ADE is a straight line
find the value of k
find the ratio AD : DE in the form x : y where x and y are integers.
Chetan owns a fruit shop. In January, Chetan sold 560 kg of citrus fruit. In February, Chetan sold 518 kg of citrus fruit.
Calculate the percentage decrease in the weight of citrus fruit sold. The table below shows the weight of citrus fruit, the weight of berries and the weight of tropical fruit Chetan sold in March.
| Fruit type | Weight sold |
|---|---|
| citrus | 508 kg |
| berries | 126 kg |
| tropical | 86 kg |
Chetan is going to draw a pie chart for this information.
Calculate the size, in degrees, of the angle of the sector in the pie chart for the weight of berries sold in March. The table below gives information about the weight, in kg, of berries sold on each of the 30 days in April.
| Weight ( kg) | Frequency |
|---|---|
| 10 | |
| 7 | |
| 6 | |
| 5 | |
| 2 |
Find the class interval that contains the median weight.
Calculate an estimate for the mean weight, in kg, of berries sold on each day in April. Chetan wants to buy 60 kg of apples for his shop from one of the following online traders. US traders French traders 12 kg box of apples for $29.50 1.72 euros per kg of apples Free delivery Total delivery cost of 22.80 euros Buy 4 boxes and get a 5th box free Special offer of 15% off the cost of apples and the cost of delivery Using an exchange rate of $1 = 0.92 euros
Figure not shown in this reconstruction — the printed paper includes a diagram (not drawn accurately). Use the text description to work through it.
compare the cost, including delivery, of 60 kg of apples bought from US traders with the cost of 60 kg of apples bought from French traders. State which of the traders is the cheaper when buying 60 kg of apples. Show all your working.
The function f is defined for all values of x by f : x ↦ 3 x 2 − 8 x≥0
Write down the range of f
Find f 2 The function g is defined by g : x ↦ 2 x 2 4 x 3 where x ≥ − 1 The function h is defined by h : x ↦ 3 x 2 6 x 2 where x ≥ − 1 Given that hg 1 x 6.1
find the value of x Show all your working.
Complete the table of values for y 2 x 3 5 x x −2.5 −2 −1.5 −1 −0.5 0 0.5 1 1.5 2 2.5 y −15.75 3.75 5.25 3 0.75 2.25 21.75

On the grid opposite, plot the points from your completed table and join them to form a smooth curve.
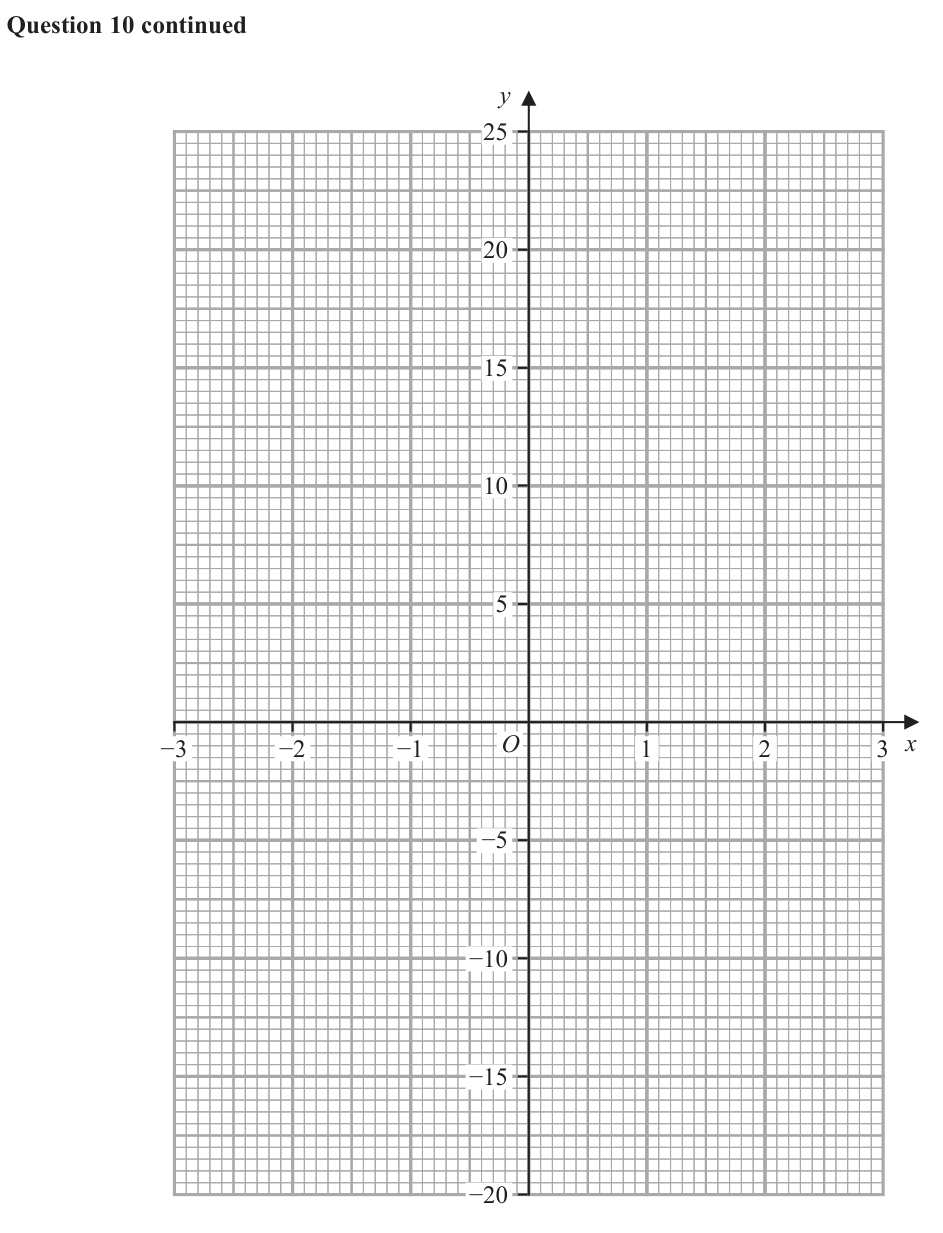
Figure not shown in this reconstruction — the printed paper includes a diagram (not drawn accurately). Use the text description to work through it.
By drawing a suitable straight line (at least 3 cm long) on the grid, find an estimate to the nearest whole number, of the gradient of the curve at the point where x
By drawing a suitable straight line on the grid, find the range of values of x, to one decimal place, in the interval −2.5 ≤ x ≤ 2.5 for which 2 x 3 5 x
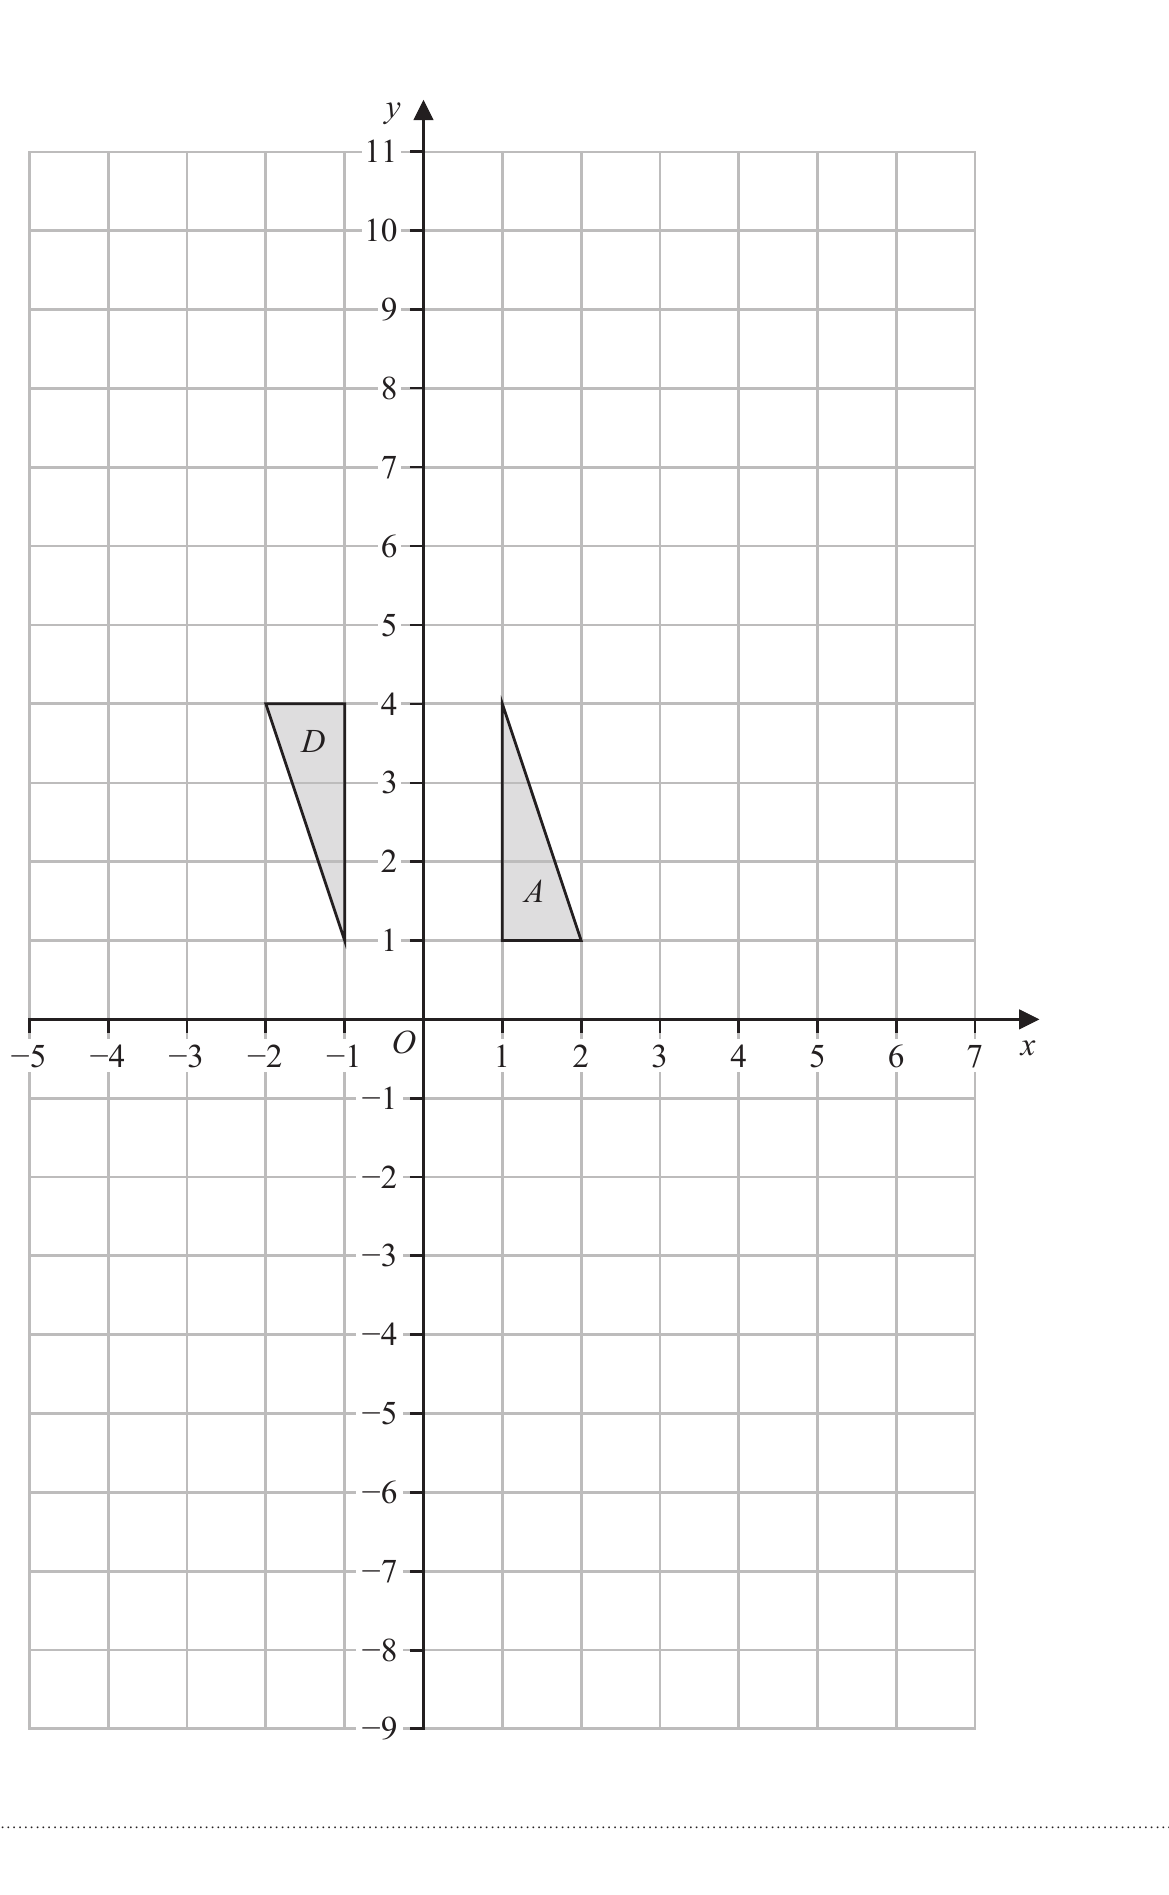
Triangle A and triangle D are drawn on the grid opposite. Triangle A is transformed to triangle B under a rotation of 180° about the point with coordinates (3, 1)
On the grid, draw and label triangle B Triangle A is transformed to triangle C under a reflection in the line with equation y 0.5
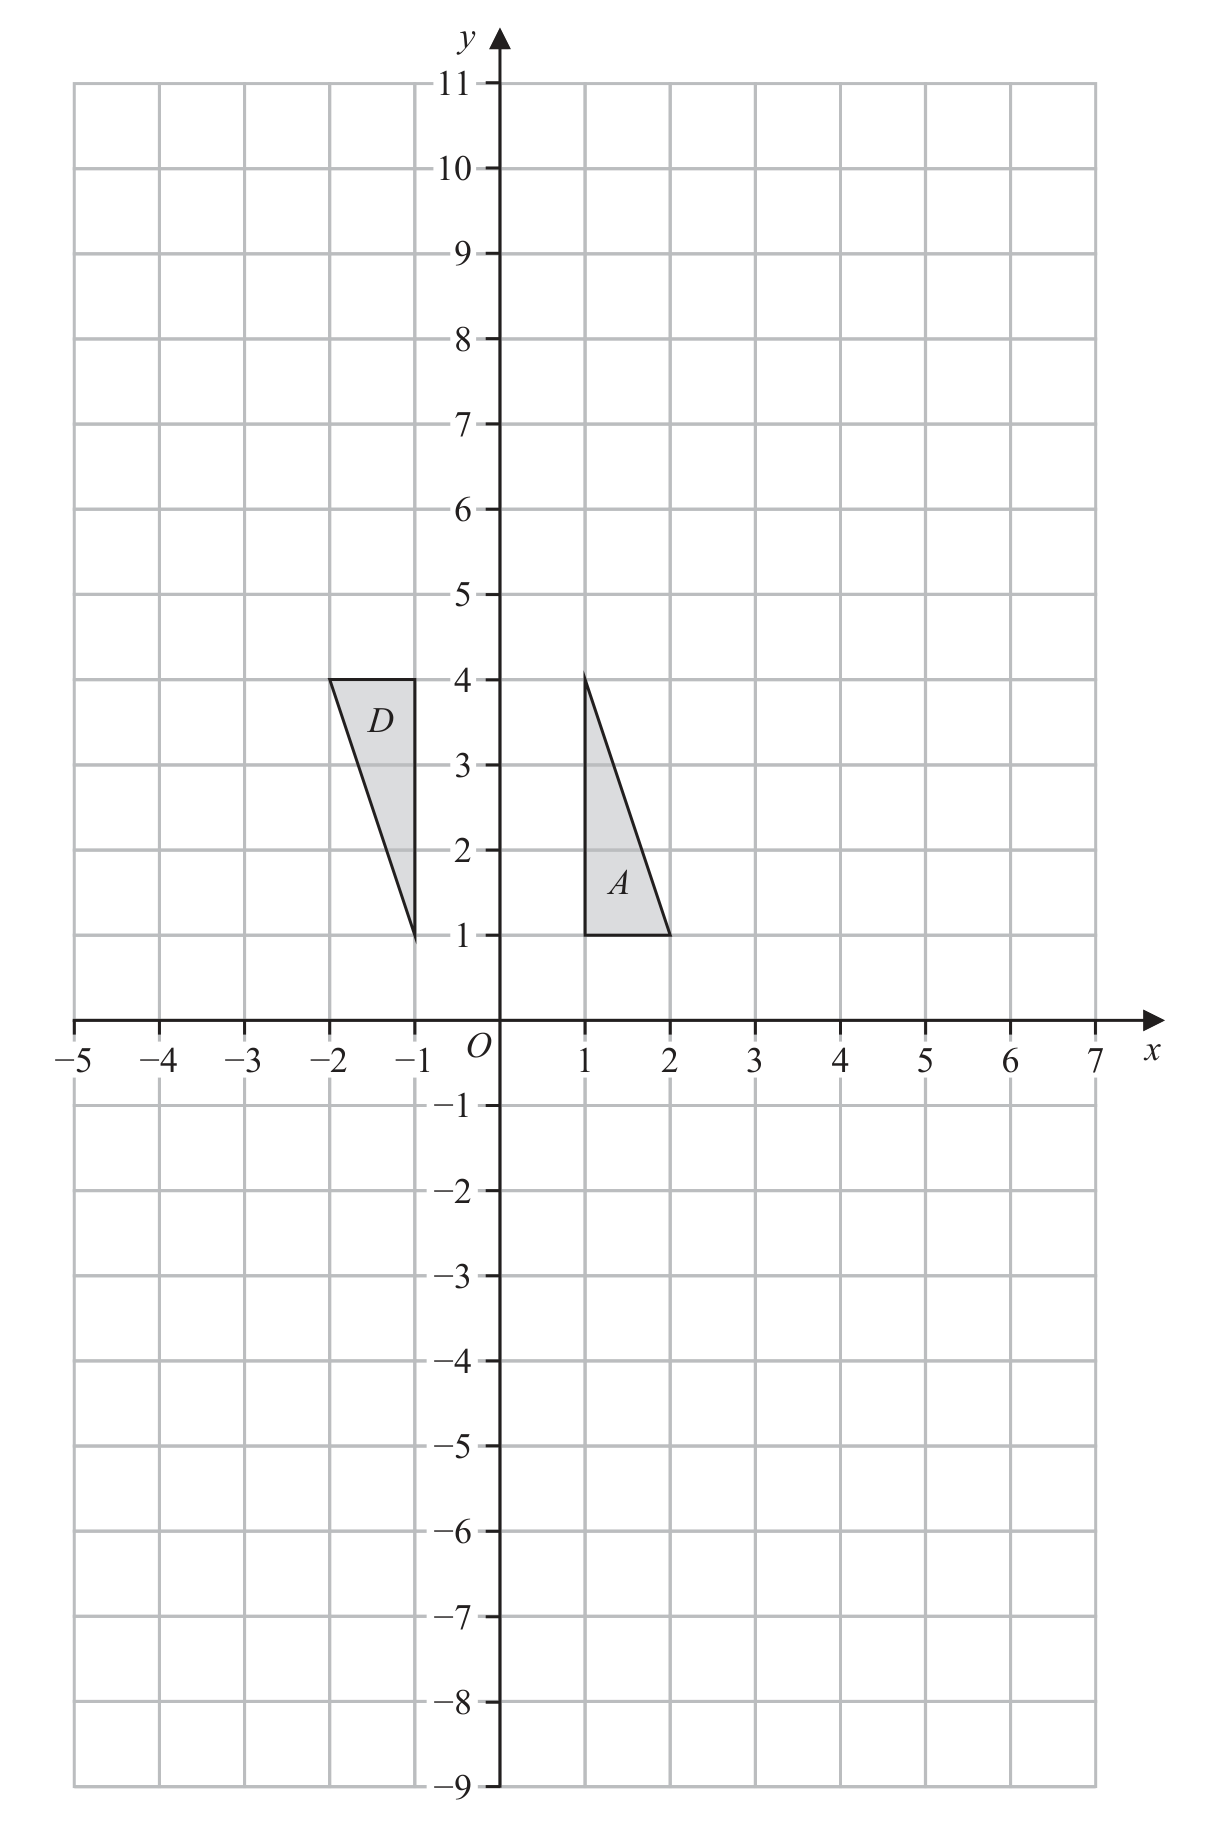
On the grid, draw and label triangle C Triangle D is transformed to triangle E under the transformation with matrix M where 2 0 M
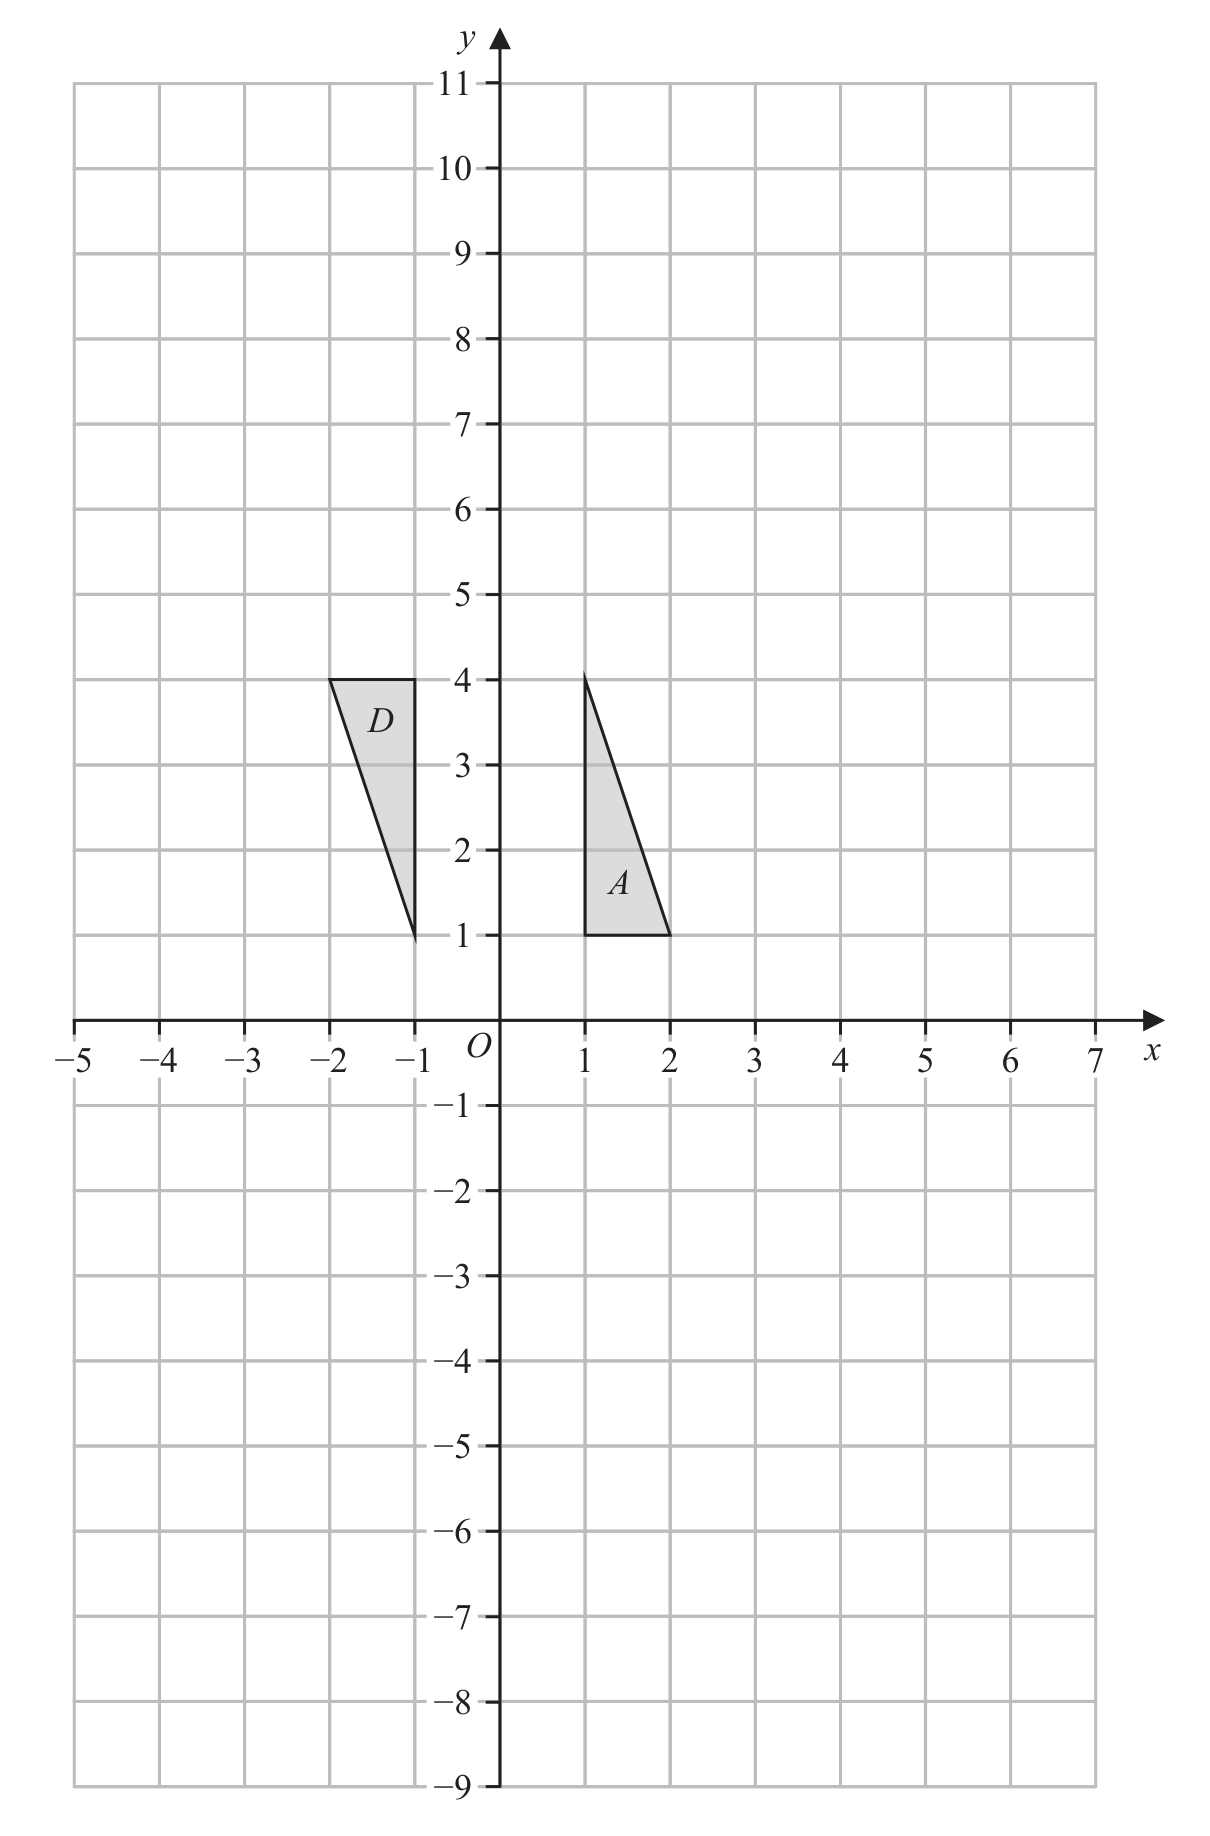
On the grid, draw and label triangle E
Describe fully the single transformation that maps triangle A onto triangle E Triangle A is transformed to triangle F under a rotation of 90° anticlockwise about the origin. 7 2k 2 Triangle F is transformed to triangle G under the matrix 2 4 Triangle G is the image of triangle A under the matrix N 1 3 Given that N 1 2 1
find the value of k.
[Inverse of matrix is ]