13 markshard
Hertford Juniors is a basketball team.
At the end of 10 games, their mean score is 35 points per game. At the end of 11 games, their mean score has gone down to 33 points per game.
How many points did the team score in the 11th game?
62 questions · 189 marks · ≈ 3 hours
Hertford Juniors is a basketball team.
At the end of 10 games, their mean score is 35 points per game. At the end of 11 games, their mean score has gone down to 33 points per game.
How many points did the team score in the 11th game?
Ed has 4 cards. There is a number on each card.
| 12 | 6 | 15 | ? |
|---|
The mean of the 4 numbers on Ed's cards is 10 Work out the number on the 4th card.
15 people were asked how long, in minutes, they had been waiting for a bus.
Here are the results.
| 2 | 3 | 3 | 4 | 5 | 6 | 6 | 8 | 9 | 10 | 11 | 13 | 14 | 15 | 18 |
|---|
Find the interquartile range of these times.
There are 18 packets of sweets and 12 boxes of sweets in a carton.
The mean number of sweets in all the 30 packets and boxes is 14. The mean number of sweets in the 18 packets is 10.
Work out the mean number of sweets in the boxes.
The table shows some information about the dress sizes of women.
| Dress size | Number of women |
|---|---|
Find the median dress size.
of the women have a shoe size of Zoe says that if you choose at random one of the women, the probability that she has either a shoe size of or a dress size of is because
Is Zoe correct? You must give a reason for your answer.
Here is the number of goals that Henri’s team scored one summer in each water polo match.
5 8 9 11 13 13 14 15 16 17 20
Find the interquartile range of the numbers of goals. Show your working clearly.
There are 15 children at a birthday party.
The mean age of the 15 children is 7 years.
9 of the 15 children are boys. The mean age of the boys is 5 years.
Work out the mean age of the girls.
The time-series graph gives some information about the number of pairs of shoes sold in a shoe shop in the first six months of 2014.
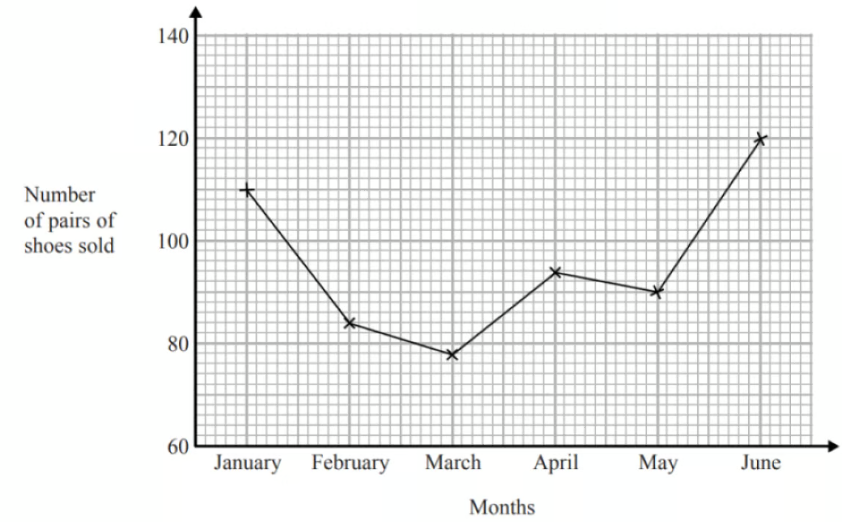
The sales target for the first six months of 2014 was to sell a mean of 96 pairs of shoes per month.
Did the shoe shop meet this sales target? You must show how you get your answer.
Twenty students took a Science test and a Maths test.
Both tests were marked out of
The table gives information about their results.
| Median | Interquartile range | |
|---|---|---|
| Science | ||
| Maths |
Use this information to compare the Science test results with the Maths test results. Write down two comparisons.
There are 10 boys and 20 girls in a class. The class has a test.
The mean mark for all the class is 60 The mean mark for the girls is 54
Work out the mean mark for the boys.
A bus company recorded the ages, in years, of the people on coach A and the people on coach B.
Here are the ages of the 23 people on coach A.
| 41 | 42 | 44 | 48 | 52 | 53 | 53 | 53 | 56 | 57 | 57 | 59 |
|---|---|---|---|---|---|---|---|---|---|---|---|
| 60 | 61 | 63 | 64 | 64 | 66 | 67 | 69 | 74 | 77 | 79 |
Complete the table below to show information about the ages of the people on coach A.
| Median | |
|---|---|
| Lower Quartile | |
| Upper Quartile | |
| Least age | 41 |
| Greatest age | 79 |
Here is some information about the ages of the people on coach B.
| Median | 70 |
|---|---|
| Lower quartile | 54 |
| Upper quartile | 73 |
| Least age | 42 |
| Greatest age | 85 |
Richard says that the people on coach A are younger than the people on coach B.
Is Richard correct? You must give a reason for your answer.
Richard says that the people on coach A vary more in age than the people on coach B.
Is Richard correct? You must give a reason for your answer.
The table shows information about the weights, in kg, of 40 parcels.
| Weight of parcel (kg) | Frequency |
|---|---|
| 19 | |
| 12 | |
| 5 | |
| 2 | |
| 2 |
Write down the modal class.
Walkden Reds is a basketball team.
At the end of 11 games, their mean score was 33 points per game. At the end of 10 games, their mean score was 2 points higher.
Jordan says,
"Walkden Reds must have scored 13 points in their 11th game."
Is Jordan right? You must show how you get your answer.
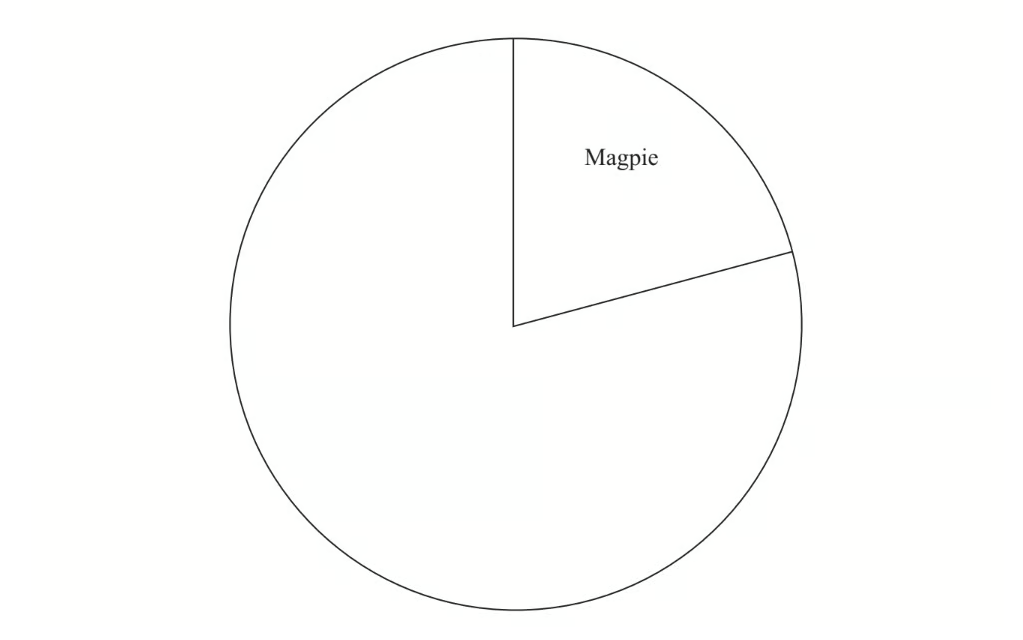
The table gives some information about the birds Paula sees in her garden one day.
| Bird | Frequency |
|---|---|
| Magpie | 15 |
| Thrush | 10 |
| Starling | 20 |
| Sparrow | 27 |
Complete the accurate pie chart.
The students in Class A and in Class B take the same examination.
The lowest score in Class A is 39 The range of scores for Class A is 57 The lowest score in Class B is 33 The range of scores for Class B is 60
Find the range of scores for all the students in both classes.
Mr Brown gives his class a test. The 10 girls in the class get a mean mark of 70% The 15 boys in the class get a mean mark of 80%
Nick says that because the mean of 70 and 80 is 75 then the mean mark for the whole class in the test is 75%
Nick is not correct. Is the correct mean mark less than or greater than 75%? You must justify your answer.
Jenny has six cards. Each card has a whole number written on it so that
the smallest number is 5 the largest number is 24 the median of the six numbers is 14 the mode of the six numbers is 8
Jenny arranges her cards so that the numbers are in order of size.

For the remaining four cards, write on each dotted line a number that could be on the card.
The table gives information about the speeds, in kilometres per hour, of 80 motorbikes as each pass under a bridge.
| Speed (s kilometres per hour) | Frequency |
|---|---|
| 10 | |
| 16 | |
| 19 | |
| 23 | |
| 12 |
Write down the modal class.
Bob asked each of friends how many minutes they took to get to work. The table shows some information about his results.
| Time taken (m minutes) | Frequency |
|---|---|
0 less than m less-than or slanted equal to 10 | |
10 less than m less-than or slanted equal to 20 | |
20 less than m less-than or slanted equal to 30 | |
30 less than m less-than or slanted equal to 40 | |
40 less than m less-than or slanted equal to 50 |
Work out an estimate for the mean time taken.
Diyar recorded the distance, in kilometres, that he cycled each day for 11 days. Here are his results.
| 8 | 10 | 12 | 13 | 5 | 23 | 21 | 7 | 5 | 16 | 14 |
|---|
Find the interquartile range of his results.
....................................................... km
The table gives information about the length of time, in minutes, that each of students took to travel to school on Monday.
| Length of time (minutes) | Frequency |
|---|---|
| 4 | |
| 10 | |
| 15 | |
| 25 | |
| 6 |
Write down the modal class interval.
Sumeet records the times, in minutes, for 40 runners to finish a half marathon. Information about these times is shown in the table.
| Time (minutes) | Frequency |
|---|---|
60 less than t less-than or slanted equal to 90 | |
90 less than t less-than or slanted equal to 120 | |
120 less than t less-than or slanted equal to 150 | |
150 less than t less-than or slanted equal to 180 | |
180 less than t less-than or slanted equal to 210 |
Calculate an estimate for the mean time.
Yusuf sat 8 examinations. Here are his marks for 5 of the examinations.
| 68 | 72 | 75 | 77 | 80 |
|---|
For his results in all 8 examinations
the mode of his marks is 80 the median of his marks is 74 the range of his marks is 16
Find Yusuf’s marks for each of the other 3 examinations.
15 students took an English test. The same 15 students took a Maths test. Both tests were marked out of 30.
For the English test results the median was 21 the interquartile range was 14
The Maths test results are shown below.
| 18 | 18 | 19 | 20 | 24 | 25 | 25 | 26 | 28 | 28 | 29 | 29 | 29 | 30 | 30 |
|---|
Use the information above to compare the English test results with the Maths test results. Write down two comparisons.
The table gives information about the heights of trees.
| Height(metres) | Frequency |
|---|---|
0 less than h less-than or slanted equal to 4 | |
4 less than h less-than or slanted equal to 8 | |
8 less than h less-than or slanted equal to 12 | |
12 less than h less-than or slanted equal to 16 | |
16 less than h less-than or slanted equal to 20 |
Work out an estimate for the mean height of the trees.
Given that the four whole numbers and have
a mode of 7 a median of 8.5 a mean of 9
Work out the value of a, the value of b and the value of .
Kim works at an airport in the UK.
She records the number of planes landing between 10 am and 2 pm each day.
The table shows the data for the first 10 days in January.
| Day | 1 | 2 | 3 | 4 | 5 | 6 | 7 | 8 | 9 | 10 |
|---|---|---|---|---|---|---|---|---|---|---|
| Number of planes | 148 | 151 | 147 | 155 | 153 | 147 | 155 | 102 | 151 | 154 |
The airport was affected by fog on one of the days.
Which day do you think it was? Give a reason for your answer.
Kim uses the data to predict how many planes will land at the airport in a year.
In her method, she
uses an estimate of 150 planes in each 4-hour period throughout the day
assumes the same number of planes each day.
Work out her prediction.
In fact,
fewer planes land in winter than in summer
fewer planes land at night than during the day.
What does this tell you about Kim’s prediction? Tick one box.
square Her prediction is too low
square Her prediction is too high
square Her prediction could be too low or too high
Give a reason for your answer.
The table gives information about the heights of girls.
| Height(metres) | Frequency |
|---|---|
1.30 less-than or slanted equal to h less than 1.40 | |
1.40 less-than or slanted equal to h less than 1.50 | |
1.50 less-than or slanted equal to h less than 1.60 | |
1.60 less-than or slanted equal to h less than 1.70 | |
1.70 less-than or slanted equal to h less than 1.80 |
Find the class interval that contains the median.
Work out an estimate for the mean height.
Sandeep sat tests in January Each test was marked out of
Here are his test results.
Find the interquartile range of these test results. Show your working clearly.
Sandeep also sat some tests in May Each test was marked out of
The median of the May test results is The interquartile range of the May test results is
In which month, January or May, were Sandeep’s test results more consistent? Give a reason for your answer.
100 men and 100 women took a test.
Scores
| Median | Interquartile range | Range | |
|---|---|---|---|
| Men | 28 | 7.5 | 31 |
| Women | 30 | 9 | 37 |
Using this data, which statement must be true? Tick one box.
square Men had a higher average score than women
square Men had more consistent scores than women
size 26px square A woman had the highest score
size 26px square A man had the lowest score
15 students took an English test. The same 15 students took a Maths test. Both tests were marked out of 30
For the English test results
the median was 21
the interquartile range was 14
The Maths test results are shown below.
18 18 19 20 24 25 25 26 28 28 29 29 29 30 30
Use the information above to compare the English test results with the Maths test results. Write down two comparisons.
The table shows information about the weekly earnings of people who work in a shop.
| Weekly earnings() | Frequency |
|---|---|
150 less than x less-than or slanted equal to 250 | |
250 less than x less-than or slanted equal to 350 | |
350 less than x less-than or slanted equal to 450 | |
450 less than x less-than or slanted equal to 550 | |
550 less than x less-than or slanted equal to 650 |
Work out an estimate for the mean of the weekly earnings.
Nadiya says,
"The mean may not be the best average to use to represent this information."
Do you agree with Nadiya? You must justify your answer.
Circle the expression for the range of consecutive integers.
In one month, the number of hours of exercise taken by 10 people are
4 7 2 8 6 5 1 82 3 9
Which is the appropriate average to use in this situation? Tick a box.
square Mean size 26px square Median size 26px square Mode
Give one reason for each of the other two averages as to why they are not appropriate.
Here are the test marks of 15 students.
7 10 14 15 16 17 18 19 20 20 23 25 30 39 40
Find the interquartile range of these marks.
The table shows some information about the foot lengths of adults.
| Foot length(cm) | Number of adults |
|---|---|
16 less-than or slanted equal to f less than 18 | |
18 less-than or slanted equal to f less than 20 | |
20 less-than or slanted equal to f less than 22 | |
22 less-than or slanted equal to f less than 24 | |
24 less-than or slanted equal to f less than 26 |
Write down the modal class interval.
Calculate an estimate for the mean foot length.
Here is some information about the times taken by 40 people to fill in a form.
| Time,minutes | Number of people |
|---|---|
| 3 | |
| 9 | |
| 11 | |
| 17 |
In which class interval is the median? Circle your answer.
Six positive numbers have
a mean of 10 a range of 19
Four of the numbers are 12 7 15 3
Work out the other two numbers.
Team A and Team B take part in a quiz league.
After 11 rounds, Team A has a mean score per round of 17 After 9 rounds, Team B has a mean score per round of 18
Both teams take part in a further round. After this round, both teams have a mean score per round of 18.5
In the further round, Team A scored more points than Team B.
How many more?
Jenny works in a shop that sells belts.
The table shows information about the waist sizes of customers who bought belts from the shop in May.
| Belt size | Waist(inches) | Frequency |
|---|---|---|
| Small | 28 less than w less-than or slanted equal to 32 | |
| Medium | ||
| Large | ||
| Extra Large |
Calculate an estimate for the mean waist size.
Belts are made in sizes Small, Medium, Large and Extra Large.
Jenny needs to order more belts in June. The modal size of belts sold is Small.
Jenny is going to order of the belts in size Small. The manager of the shop tells Jenny she should not order so many Small belts.
Who is correct, Jenny or the manager? You must give a reason for your answer.
102 boys and 85 girls took a test.
The table shows information about the mean marks.
| Boys | Girls | |
|---|---|---|
| Number of students | 102 | 85 |
| Mean mark | 68.5 | 72.4 |
The pass mark for the test was 70 Was the mean mark for all of these students greater than the pass mark? You must show your working.
A station manager looks at the information below.
| Number of minutes late, | Number of trains |
|---|---|
| 12 | |
| 0 | |
| 7 | |
| 0 | |
| 0 | |
| 1 |
Estimate the mean number of minutes late.
The table shows information about the lengths, in minutes, of 50 telephone calls.
| Length of telephone call ( minutes) | Frequency |
|---|---|
| 8 | |
| 2 | |
| 6 | |
| 4 | |
| 12 | |
| 18 |
Write down the modal class.
Work out an estimate for the total length, in minutes, of these telephone calls.
25 students in class A did a science exam. 30 students in class B did the same science exam.
The mean mark for the 25 students in class A is 67.8 The mean mark for all the 55 students is 72.0
Work out the mean mark for the students in class B.
Here is some information about 26 houses.
and are all different numbers.
| Number of bedrooms | Number of houses |
|---|---|
| 1 | 7 |
| 2 | |
| 3 | |
| 4 | |
| 5 | 8 |
The median number of bedrooms is 3.5
Work out a possible set of values for and .
The mean mass of a squad of 19 hockey players is 82 kg
A player of mass 93 kg joins the squad.
Work out the mean mass of the squad now.
.......................kg
Robert asked 11 people how many meetings they attended last week.
Here are the results in numerical order.
1 2 4 6 6 8 11 12 13 14 17
Find the interquartile range of the number of meetings.
The pie charts give information about the ages, in years, of people living in two towns, Adley and Bridford.
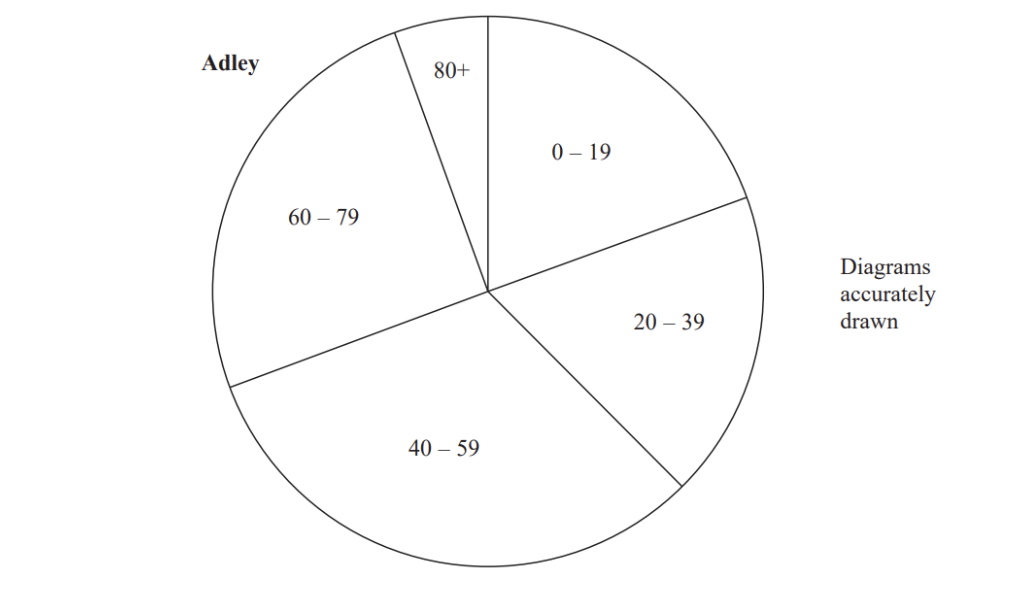
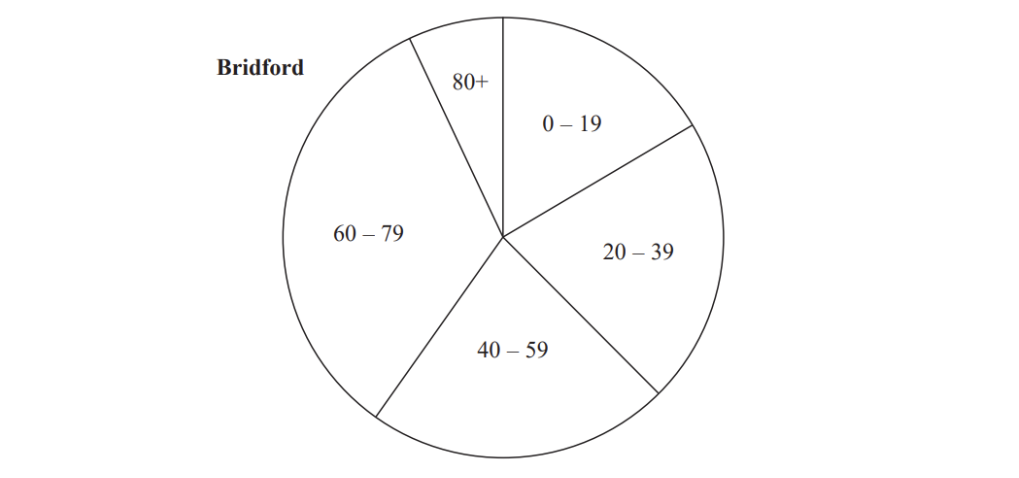
The ratio of the number of people living in Adley to the number of people living in Bridford is given by the ratio of the areas of the pie charts. What proportion of the total number of people living in these two towns live in Adley and are aged 0 – 19? Give your answer correct to 3 significant figures.
200 people recorded the time they spent on social media one day.
The table shows the results.
| Time, t (mins) | Frequency | Midpoint | |
|---|---|---|---|
| 24 | |||
| 76 | |||
| 52 | |||
| 48 | |||
| Total = 200 |
Work out an estimate of the mean time.
..................................mins
The table shows information about the times for 10 people to complete a task.
| Time,(minutes) | Frequency |
|---|---|
| 1 | |
| 6 | |
| 3 |
These statements are about the mean and range of the actual times. Tick the correct box for each statement.
| True | False | |
|---|---|---|
| The mean could be less than 20 minutes | square | |
| The mean could be more than 40 minutes | square | square |
| The mean could be less than 40 minutes | square | square |
| The range could be more than 40 minutes | square | square |
| The range could be less than 40 minutes | square | square |
| The range could be more than 60 minutes | square | square |
Here are two sets of numbers, A and B.
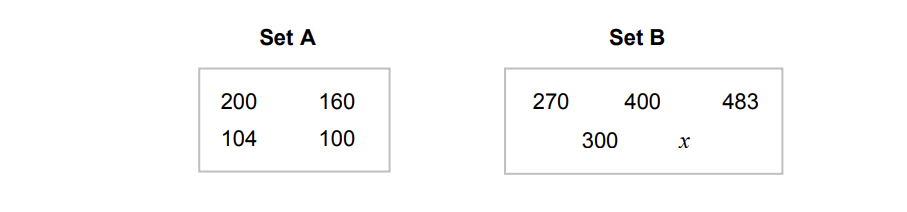
mean of Set A : mean of Set B = 3 : 8
Work out the value of
The table shows information about the distances walked by 120 students on their way to school one week.
| Distance,(miles) | Frequency | ||
|---|---|---|---|
| 20 | |||
| 48 | |||
| 30 | |||
| 22 | |||
| Total = 120 |
Work out an estimate for the mean distance.
...................miles
Students in a class took a spelling test.
The diagram shows information about the scores.
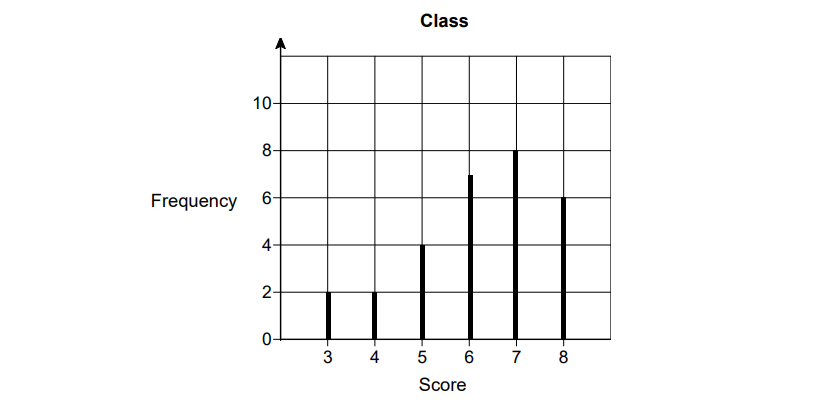
Lucy is one of the 29 students in the class.
Her score was the same as the median score for her class.
Work out her score.
Fran asks each of 40 students how many books they bought last year.
The chart below shows information about the number of books bought by each of the 40 students.
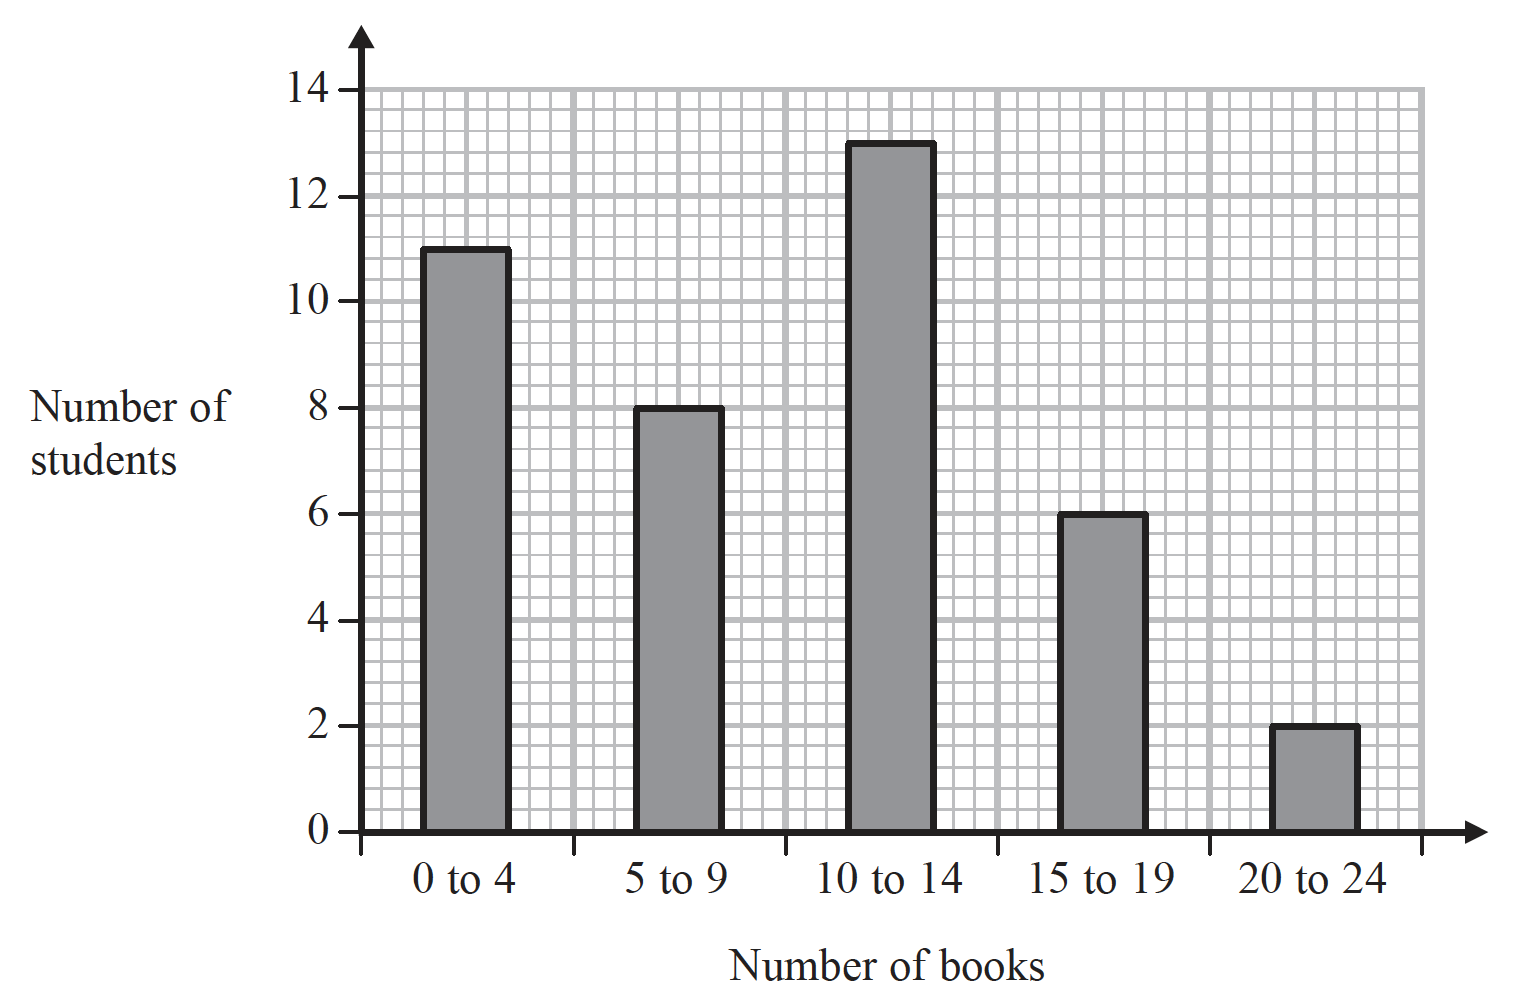
Work out the percentage of these students who bought 20 or more books.
...........%
Show that an estimate for the mean number of books bought is 9.5 You must show all your working.
A shop records the time taken by its customers to complete a purchase on its website. The results from one day are summarised in this table.
| Time taken ( minutes) | Number of customers | ||
|---|---|---|---|
| 6 | |||
| 10 | |||
| 6 | |||
| 2 | |||
| 1 |
Calculate an estimate of the mean time taken.
....................... minutes
Explain why it is not possible to use the information from this table to calculate the exact value of the mean time taken.
Ping chooses four numbers.
The mode of these four numbers is 8, the range is 7 and the mean is 11.
Find Ping’s four numbers.
The mean number of goals scored by a hockey team in 8 matches is 6 The team plays 2 more matches and scores goals in each match. The mean number of goals scored by the hockey team in the 10 matches is 7
Work out the value of
The police record the speed of vehicles passing a speed checkpoint. The speeds are recorded in the table below.
| Speed (s mph) | Number of vehicles | ||
|---|---|---|---|
| 5 | |||
| 8 | |||
| 37 | |||
| 47 | |||
| 3 |
i) Calculate an estimate of the mean speed of the vehicles.
..................... mph [4]
ii) Explain why it is not possible to use the information from this table to calculate the exact value of the mean speed.
(1 mark)
Jenny played four games of golf. For these games her modal score was 76 and her mean score was 75. Her range of scores was 10.
What were her scores for the four games?
The table gives information about the number of minutes that Abby spent walking each day in September.
| Number of minutes () | Frequency |
|---|---|
| 5 | |
| 6 | |
| 8 | |
| 9 | |
| 2 |
Work out an estimate for the total number of minutes that Abby spent walking in September.
Ceri records the time taken, minutes, to travel to school for a sample of 168 students at her Academy.
| Time taken (minutes) | Frequency |
|---|---|
| 54 | |
| 50 | |
| 44 | |
| 20 |
Ceri says
The longest time that any of these students took to travel to school was 80 minutes.
Is she correct? Give a reason for your answer.
Ceri also claims that 25% of all of the students at this Academy took more than 30 minutes to travel to school.
i) Show how Ceri might have worked out her claim.
(2 marks)
ii) State one assumption that Ceri has made in making her claim.
(1 mark)
Ian plays 7 games of cricket. His mean score per game for these 7 games is 42 runs.
Ian is going to play one more game of cricket. He wants his mean score per game for the 8 games to be exactly 50 runs.
How many runs must he score in his 8th game?