Speed-Time Graphs (Edexcel IGCSE Maths)
Spec point —
4.4F
Speed-time graphs
How do I use a speed-time graph?
-
Kinematics is the study of motion of objects
- It looks at how an object moves over time
-
Speed-time graphs show the speed of an object at different times
- Speed is on the vertical axis
- Time is on the horizontal axis
-
The gradient of the graph is the acceleration
-
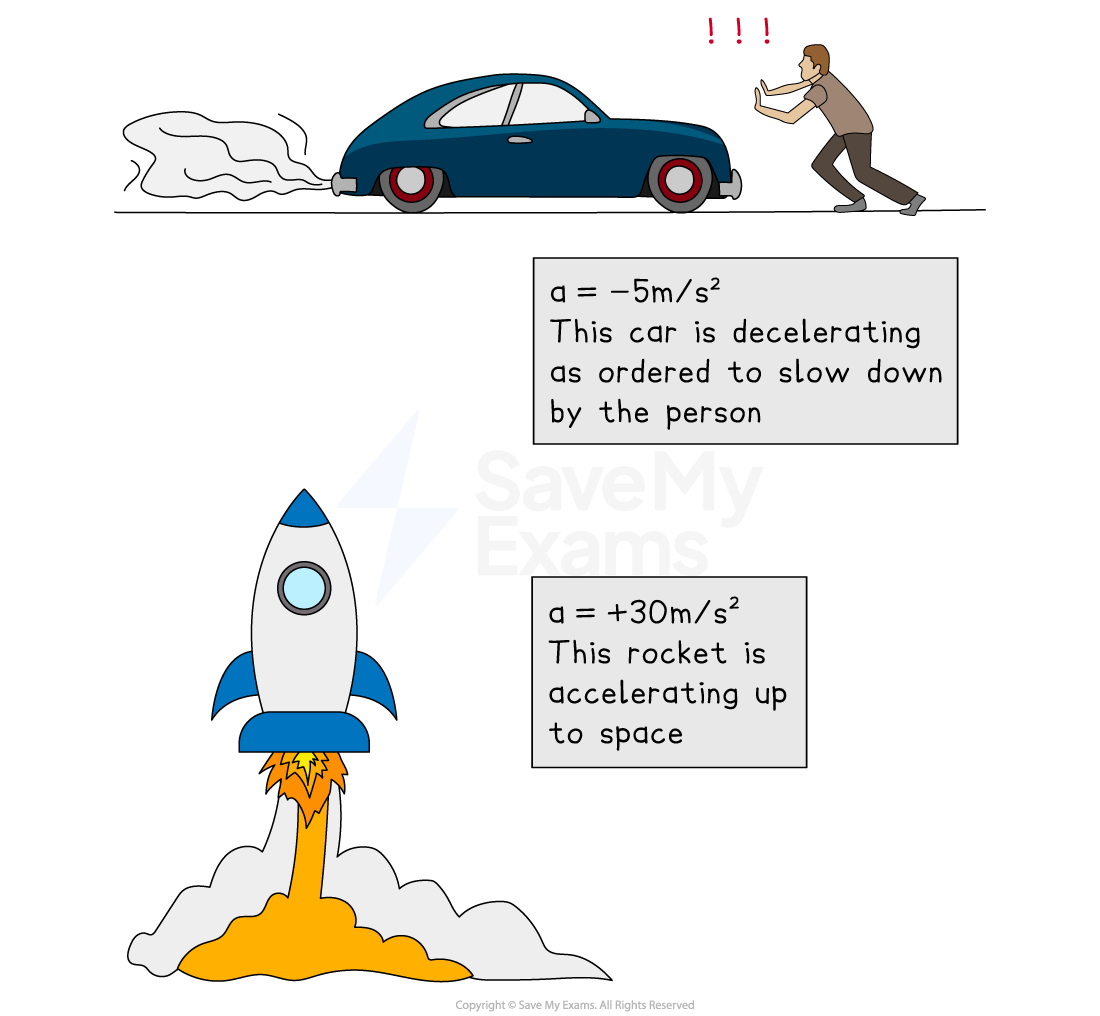
A positive gradient shows positive acceleration (speeding up)
-
A negative gradient shows negative acceleration, (slowing down)
- This is also called deceleration
-
Horizontal lines indicate moving at a constant speed
- The object is neither speeding up or slowing down
- If the constant speed is zero, then it is at rest
-
A straight line shows constant acceleration
-
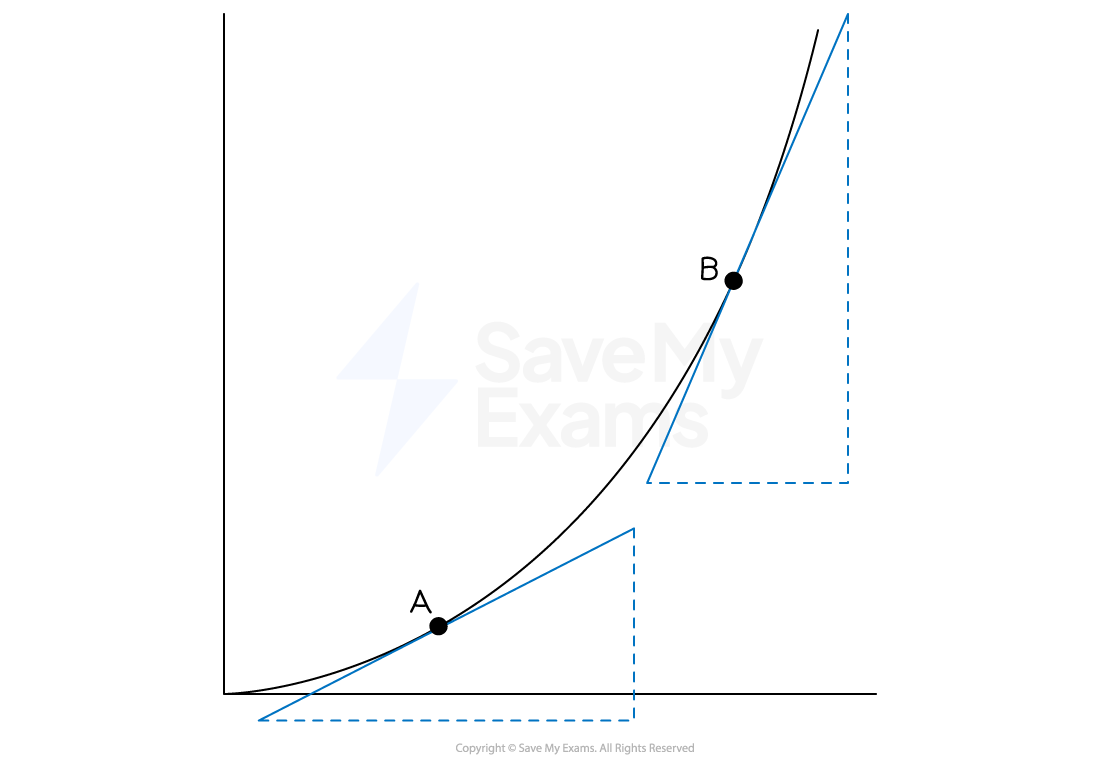
A curve shows changing acceleration
-
To find the acceleration at a particular point on the graph
- draw a tangent to the graph at this point and find its gradient
-
-
The distance covered by the object is the area under the graph
- Split the area into simple shapes, e.g. rectangles and triangles
- Find the area of each shape and add them together
Exam Hint Always check the vertical axis to see if you are given a speed-time graph or a distance-time graph!
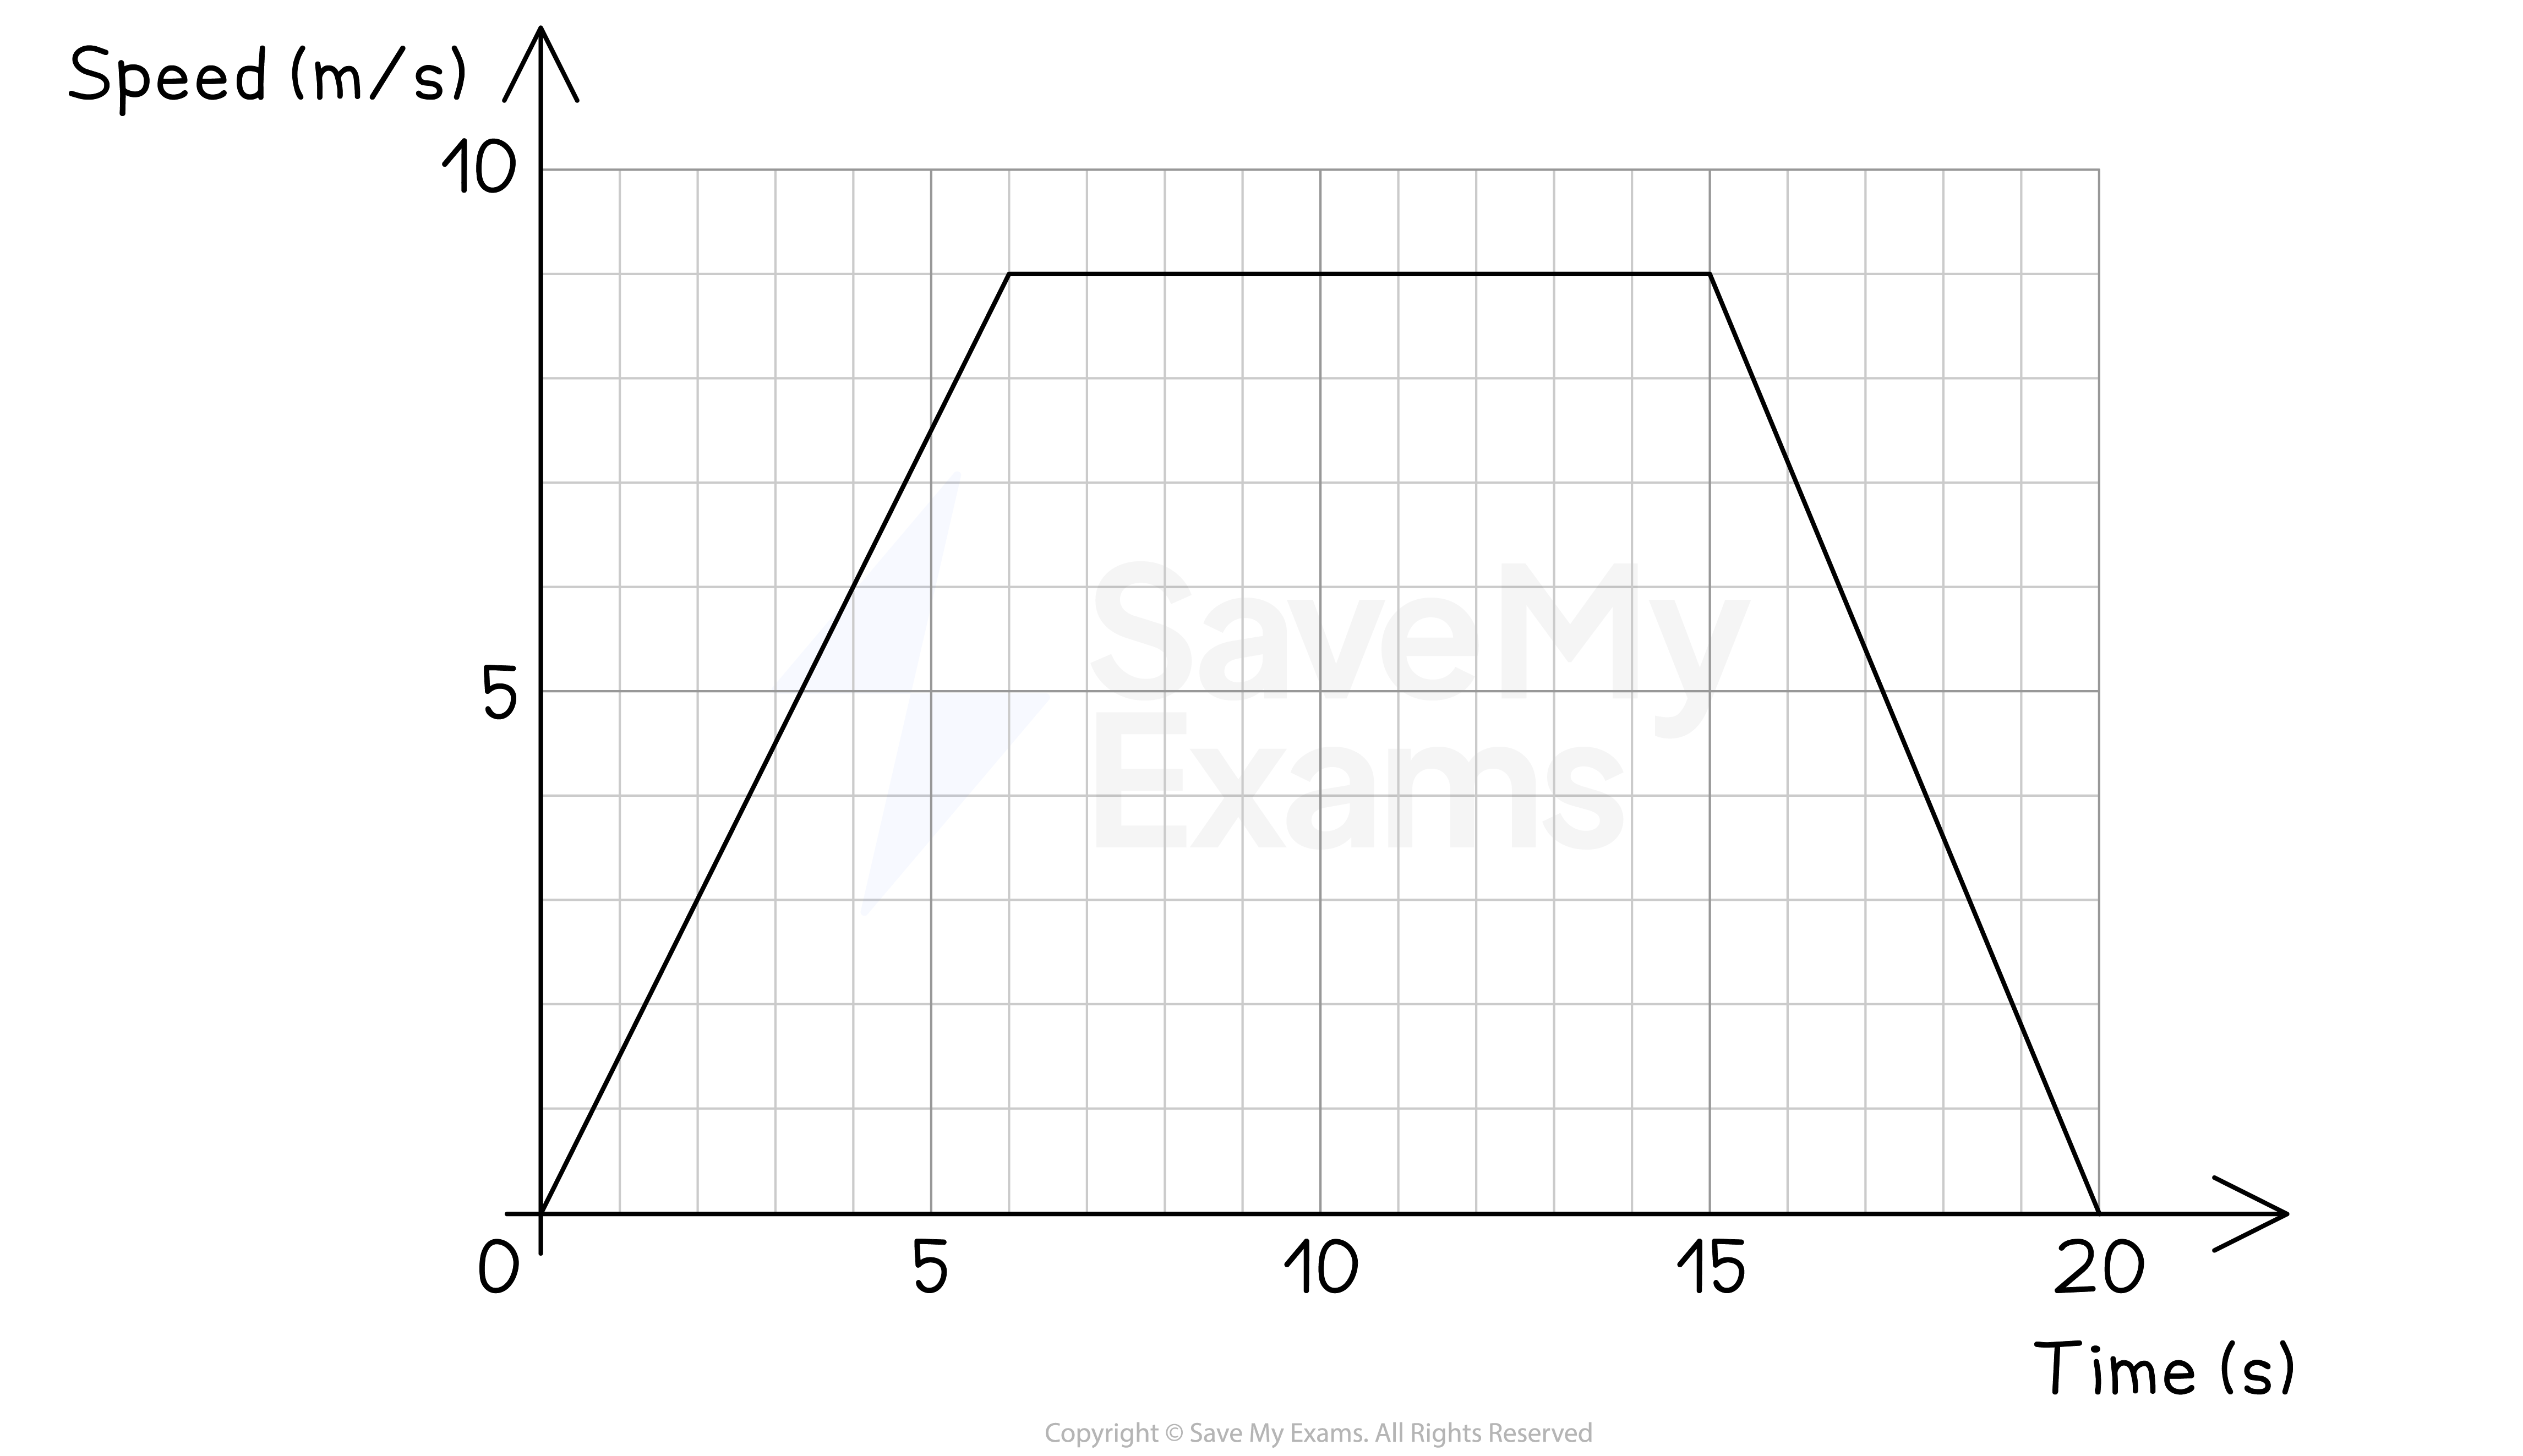
Worked Example The speed-time graph for a car travelling between two sets of traffic lights is shown below.
(a) For how long was the car travelling at a constant speed?
Answer:
Constant speed is represented by horizontal lines
There is a horizontal line from 6 seconds to 15 seconds
15 - 6 = 9
Final answer: 9 seconds
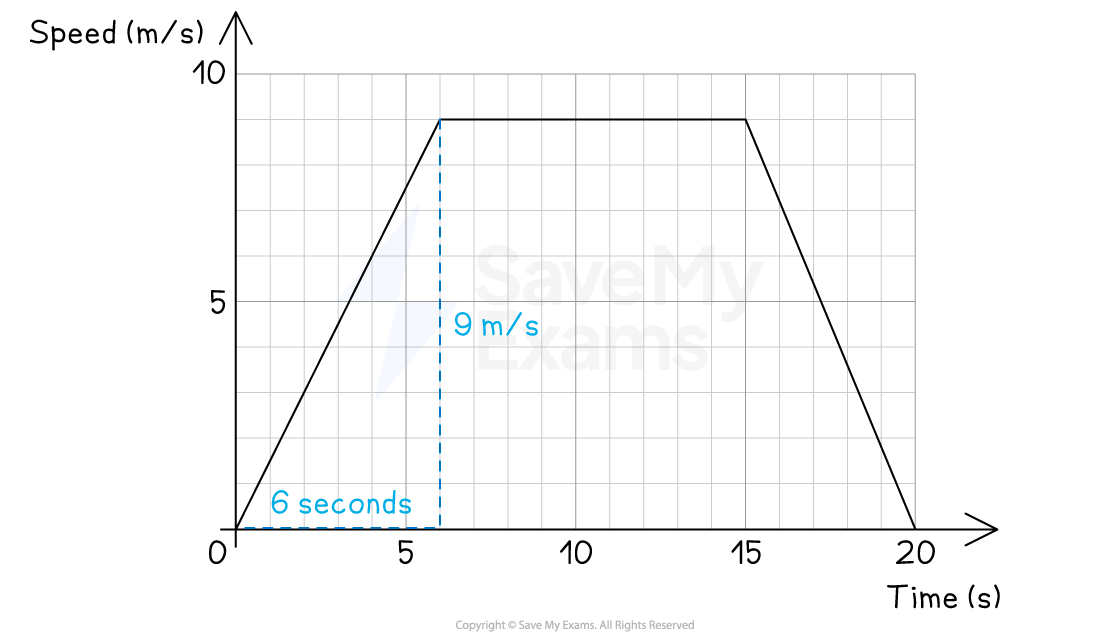
(b) Calculate the acceleration during the first 6 seconds.
Answer:
In a speed-time graph the acceleration is the gradient of the graph
Final answer: Acceleration = 1.5 m/s2
(c) Work out the distance covered by the car.
Answer:
In a speed-time graph the distance travelled is equal to the area under the graph
- The graph is a trapezium so use the formula *
- *
Final answer: Distance travelled = 130.5 m
Was this revision note helpful?
Build on this topic