Drawing Graphs from Tables (Edexcel IGCSE Maths)
Drawing Graphs Using a Table
Spec point —
3.3I
How do I draw a graph using a table of values?
-
To create a table of values
-
substitute different x-values into the equation
- This gives the y-values
-
-
To plot the points
-
use the x and *y-*values to mark crosses on the grid at the coordinates ( x , y )
- Each point is expected to be plotted to an accuracy within half of the smallest square on the grid
-
-
Draw a single smooth freehand curve
-
Go through all the plotted points
-
Make it the shape you would expect
- For example, quadratic curves have a vertical line of symmetry
-
Do not use a ruler for curves!
-
Which numbers should I be careful with?
-
For quadratic graphs, be careful substituting in negative numbers
-
Always put brackets around negative values and use BIDMAS
- For example, substitute x = -3 into y = -x2 + 8x
- This becomes y = -(-3)2 + 8(-3)
- which simplifies to -9 - 24
- so y = - 33
-
-
For reciprocal graphs like , or , do not include x = 0
-
You cannot divide by zero
- You get an **error **on your calculator
-
There is** no value** at x = 0
- The curved branches can't cross the y-axis **
- There will be a** vertical asymptote at x = 0
-
An example is given below with
-
| -3 | -2 | -1 | 0 | 1 | 2 | 3 | |
|---|---|---|---|---|---|---|---|
| No value |
-
You should also be careful when there is a combination of different types of function
- E.g. has a quadratic term and a reciprocal term
- This makes it harder to know the shape of the graph
- But you can still use a table of values to plot them
- Just be aware of points like x = 0 as described above, where there will be no value
How do I use the table function on my calculator?
-
**Calculators **can create tables of values for you
-
Find the** table** function
-
Type in the graph equation (called the function, f(x))
- Use the alpha button then X or x
- Press = when finished
-
If you are asked for another function, g(x), press = to ignore it
-
-
Enter the start value
- The first x-value in the table
- Press =
-
Enter the end value
- The last x-value in the table
-
Enter the step size
- How big the steps (gaps) are from one x-value to the next
- Press =
-
Then scroll up and down to see all the y-values
Exam Hint If you find a point that doesn't seem to fit the shape of the curve, check your working!
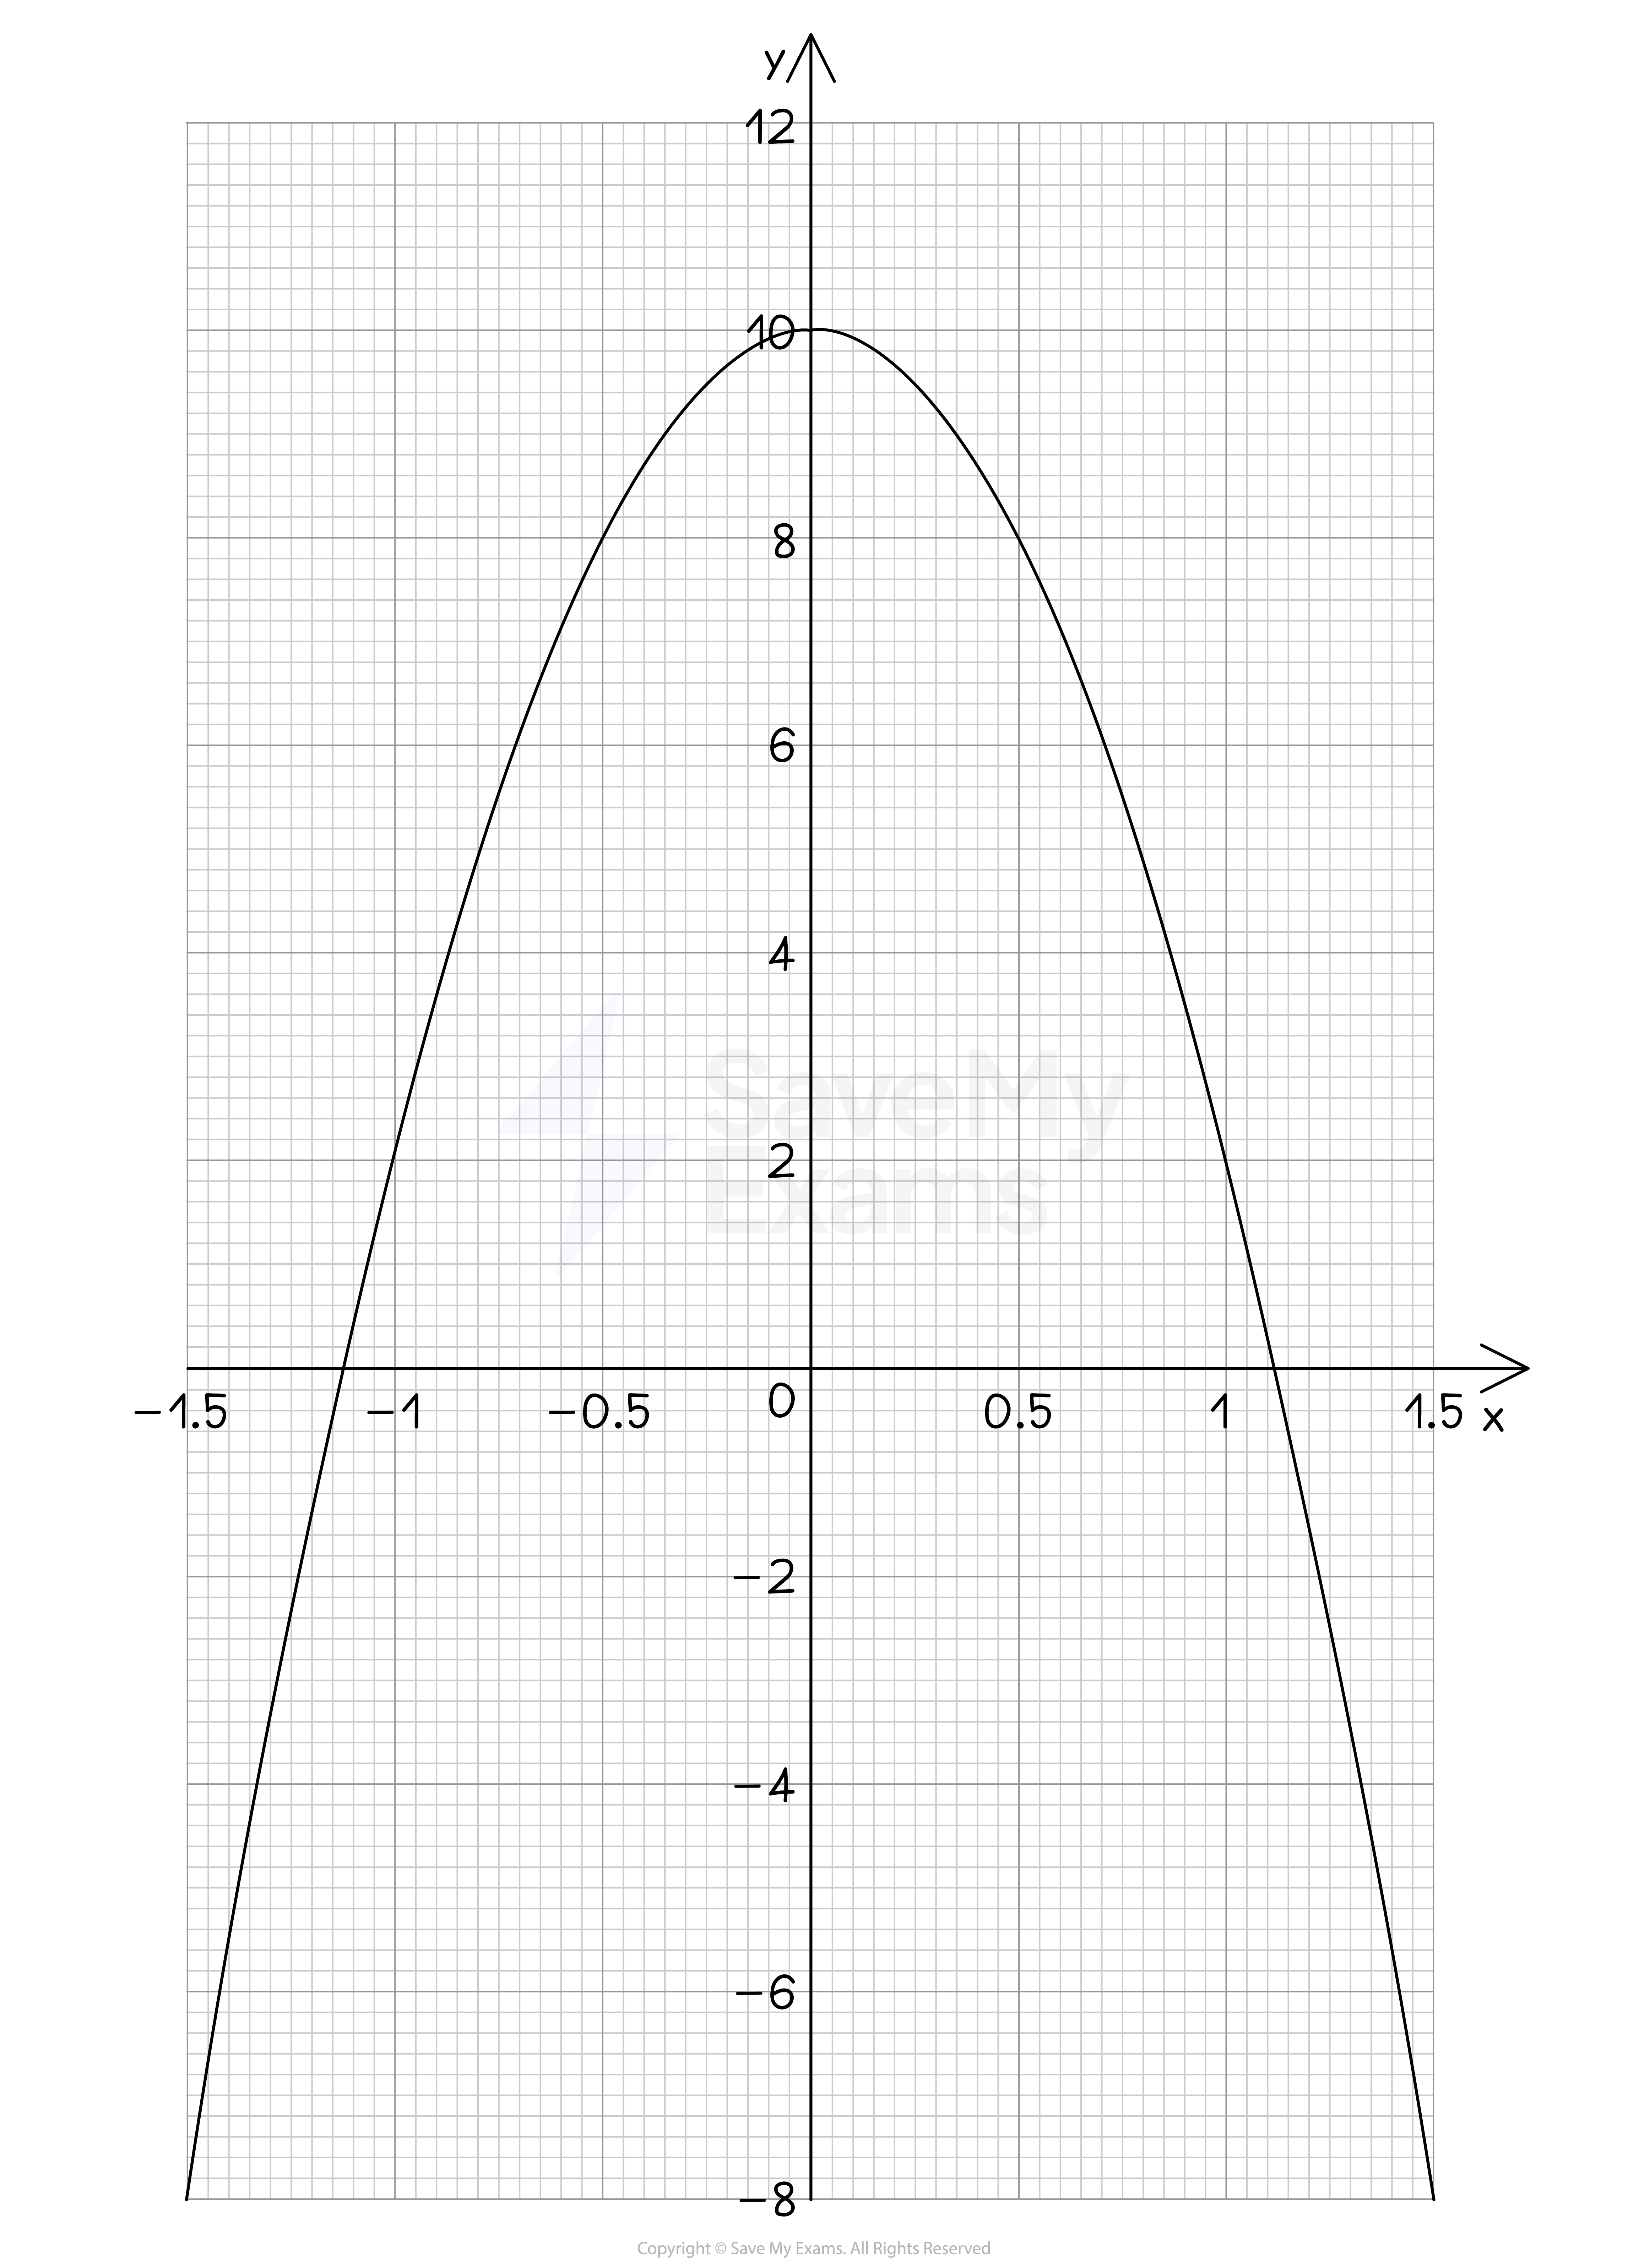
Worked Example (a) Complete the table of values for the graph of .
Answer:
Use the table function on your calculator for Start at -1.5, end at 1.5 and use steps of 0.5
Alternatively, substitute the x-values into the equation, for example x = -1.5
Final answer: -8 Final answer: 8 Final answer: 10 Final answer: 8 Final answer: 2 (b) Plot the graph of on the axes below, for values of from to .
Answer:
Carefully plot the points from your table on to the grid Note the different scales on the axes
Join the points with a smooth curve (do not use a ruler)
(c) Write down the equation of the line of symmetry of the curve.
Answer:
The curve is symmetrical about the y-axis
The equation of the y-axis is x = 0
Final answer: x = 0
Was this revision note helpful?