Drawing Histograms (Edexcel IGCSE Maths)
Spec point —
6.1A
Drawing histograms
What is a histogram?
-
A histogram looks similar to a bar chart, but there are important differences
-
Bar charts are used for discrete (and sometimes non-numerical) data
- In a bar chart, the height (or length) of a bar determines the frequency
- There are usually gaps between the bars
-
Histograms are used with continuous data, grouped into class intervals(usually of unequal width)
-
In a histogram, the area of a bar determines the frequency
- This means it is difficult to tell anything simply from looking at a histogram
- Some basic calculations will be needed for conclusions and comparisons to be made
-
There are no gaps between the bars
-
How do I draw a histogram?
-
Drawing a histogram first requires the calculation of the frequency densities for each class interval (group)
- Use
- Exam questions often ask you to finish an incomplete histogram, rather than start with a blank graph
-
Once the frequency densities are known, the bars (rectangles) for each class interval can be drawn
- with widths being measured on the horizontal (x) axis
- and the height of each bar (the frequency density) being measured on the vertical (y) axis
- As the data is continuous, the bars will be touching
Exam Hint Always work out and write down the frequency densities.
It is easy to make errors and lose marks by going straight to the graph.
Method marks may depend on showing you know to use frequency density rather than frequency.
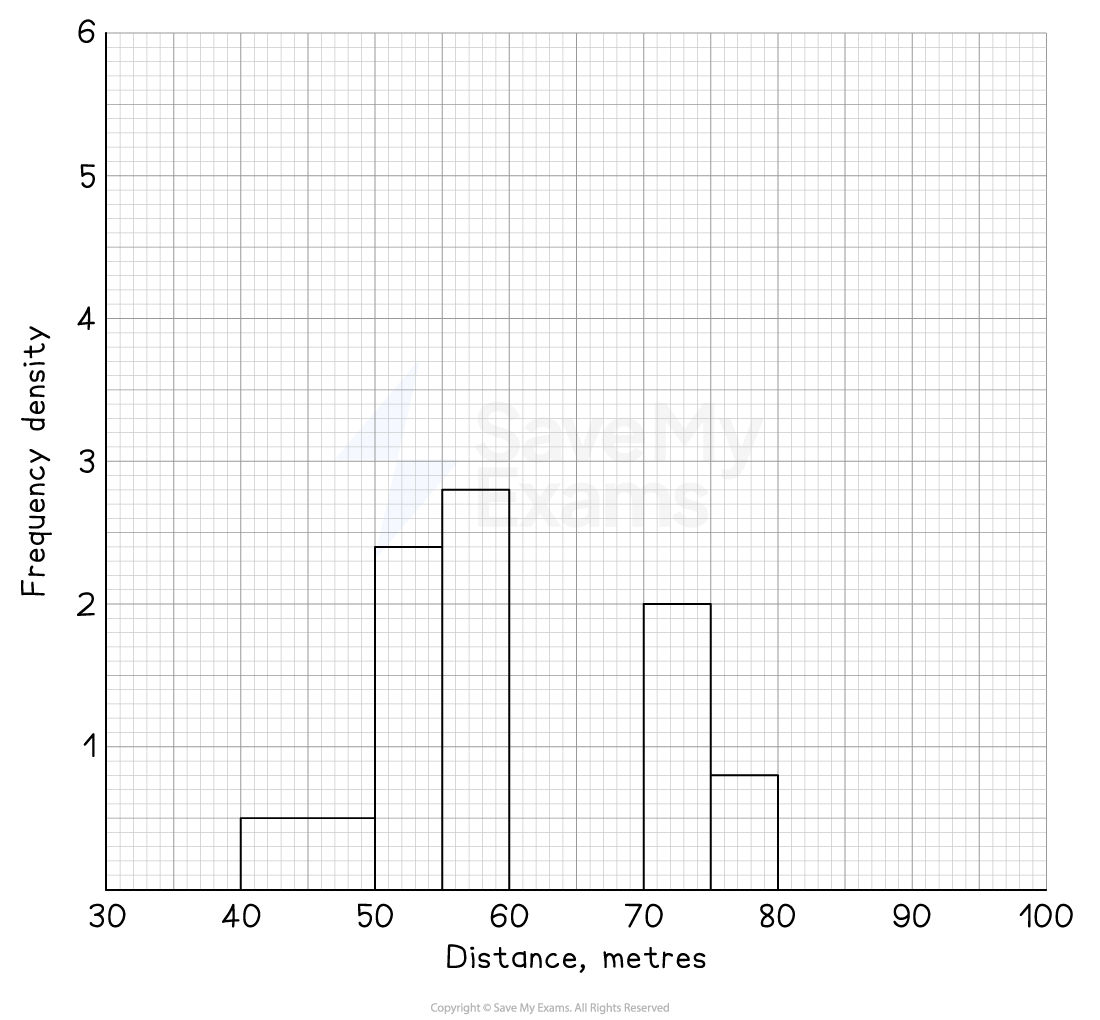
Worked Example A histogram is shown below representing the distances achieved by some athletes throwing a javelin.
There are two classes missing from the histogram.
These are:
Distance,m Frequency 8 2 Add these to the histogram.
Answer:
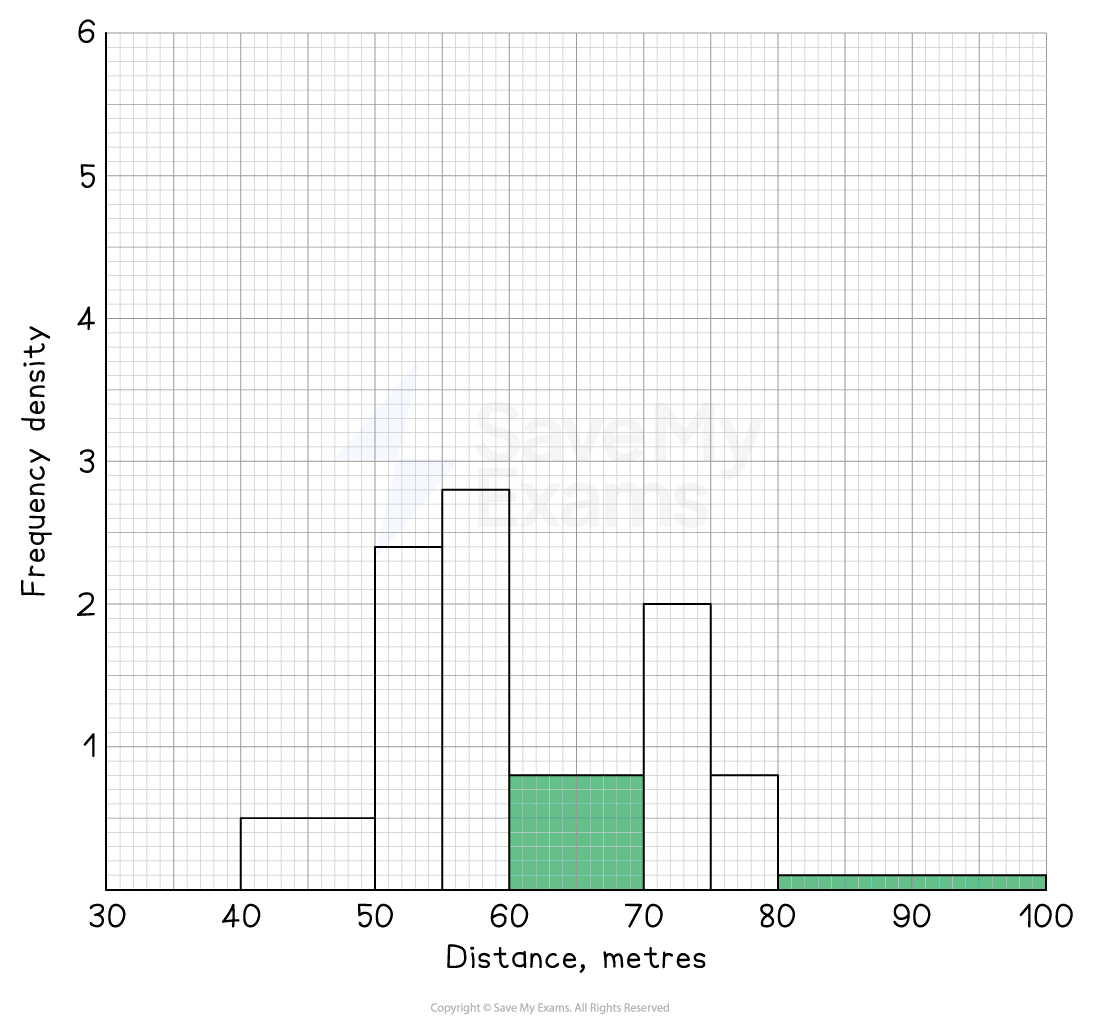
Before completing the histogram, remember to show clearly you've worked out the missing frequency densities
Distance,m Frequency Class width Frequency density 8 70 - 60 = 10 8 ÷ 10 = 0.8 2 100 - 80 = 20 2 ÷ 20 = 0.1 Now the bars can be drawn on the histogram They should stretch along the x-axis from the start to the end of the class interval The heights will be equal to the frequency densities
Was this revision note helpful?
Build on this topic