Probabilities from Venn Diagrams (Edexcel IGCSE Maths)
Probability & Venn Diagrams
Spec point —
1.5E
How do I find probabilities from Venn diagrams?
-
If the Venn diagram shows frequencies in the region
- Add together the frequencies in the regions you want
- Divide by the total frequency
-
If the Venn diagram shows the individual elements
- Count the **number of elements you **want
- Divide by the**** total number of elements
-
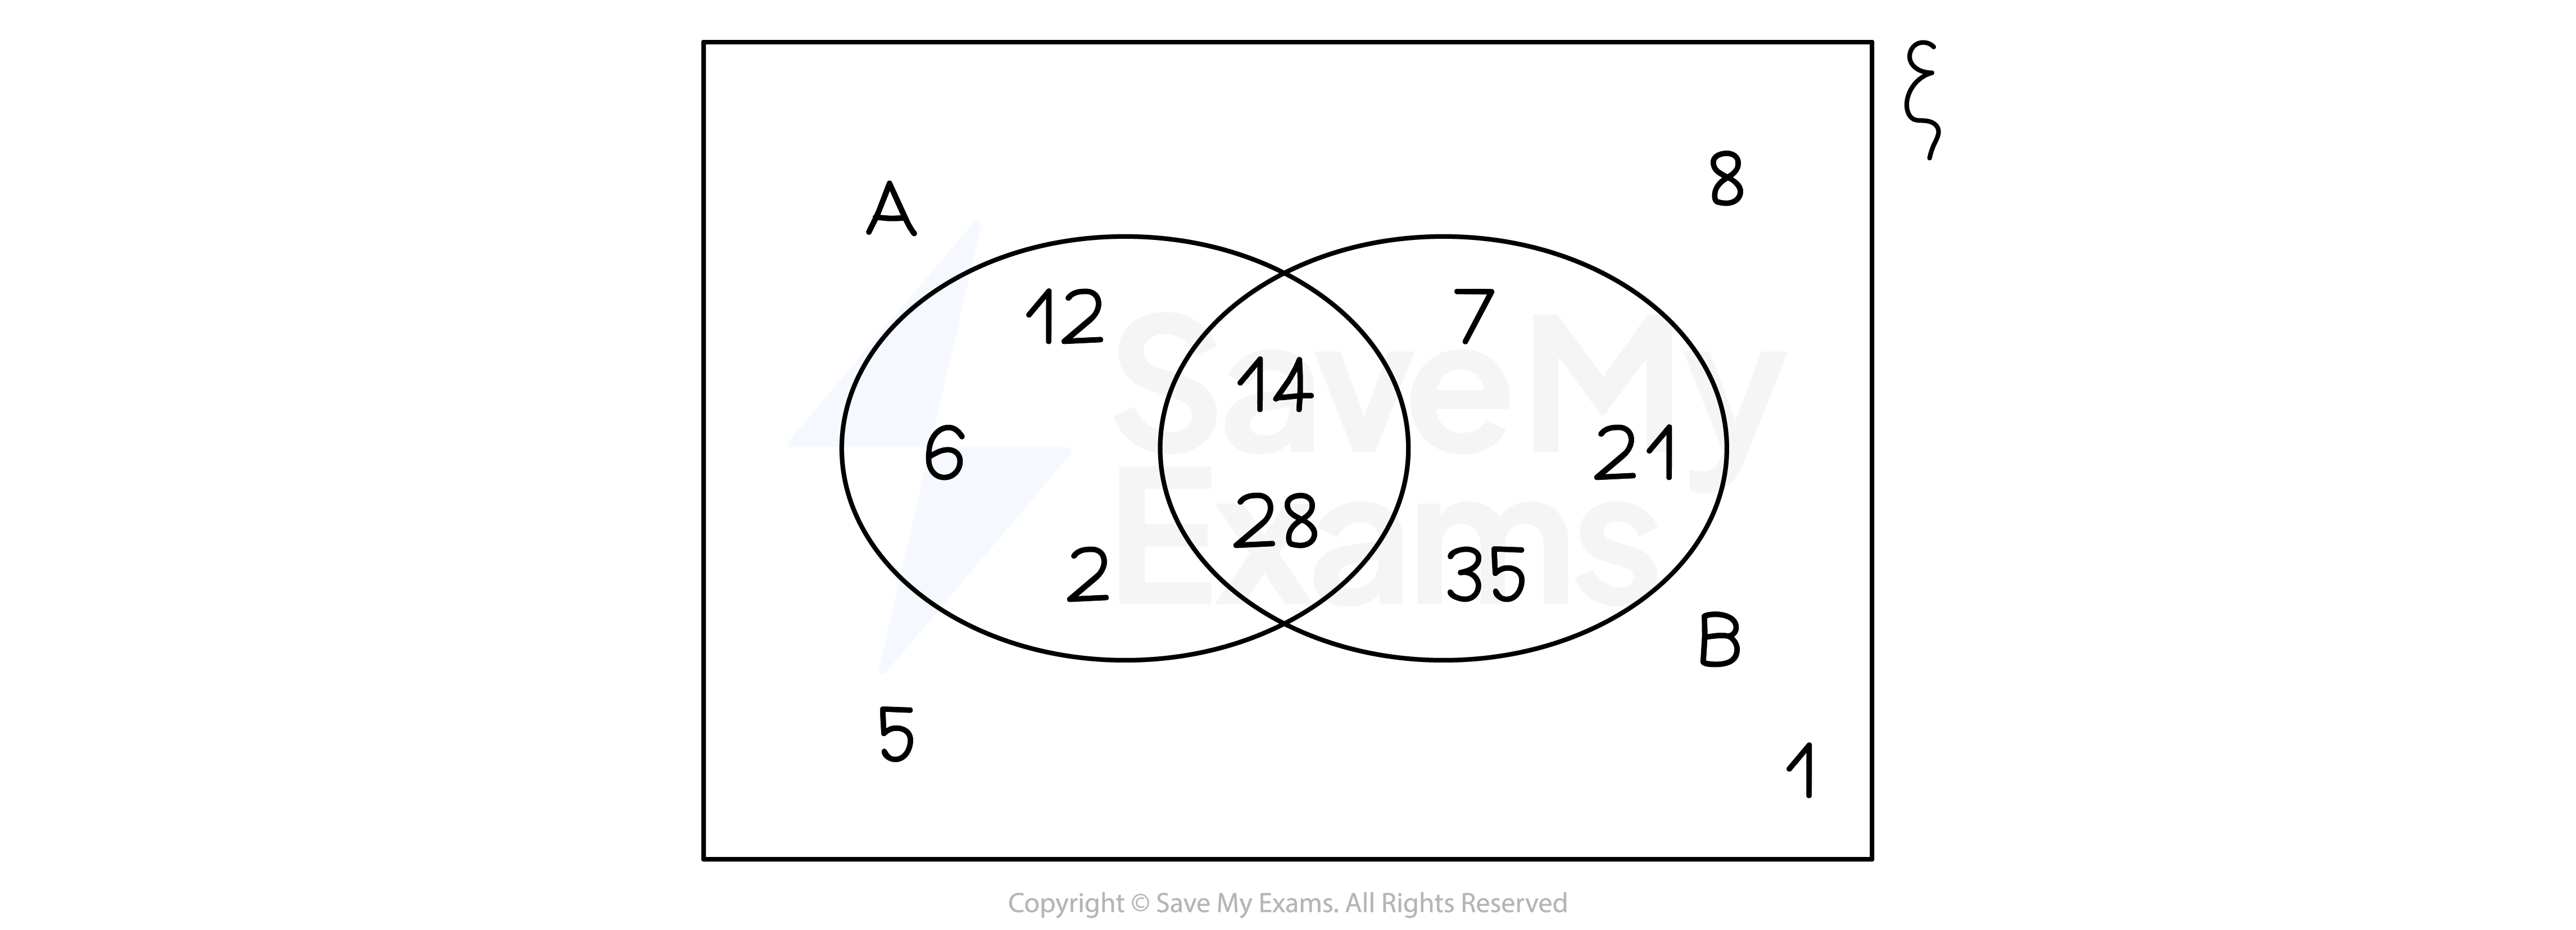
For the Venn diagram shown below,
-
The probability of being in A is
- There are 5 elements in A out of 11 in total
-
The probability of being in both A and B is
- There are 2 elements in A and B (the intersection)
-
The probability of being in A, but not B, is
- 3 elements are in A but not B
-
-
Some harder questions are not out of the total number, but out of a restricted number
-
The probability of being in B, given that you are already in A, is
- You are only interested in elements in A
- There are 5 elements in A, out of which only 2 are also in B
-
Exam Hint
Be careful when filling in numbers for a Venn diagram
- Some of the given numbers may need to be split between two sections of the Venn diagram
Suppose 10 people have a cat, 8 people have a dog and 6 people have both a cat and a dog
Out of the 10 people who have a cat
- 6 also have a dog
- 4 do not have a dog
Out of the 8 people who have a dog
- 6 also have a cat
- 2 do not have a cat
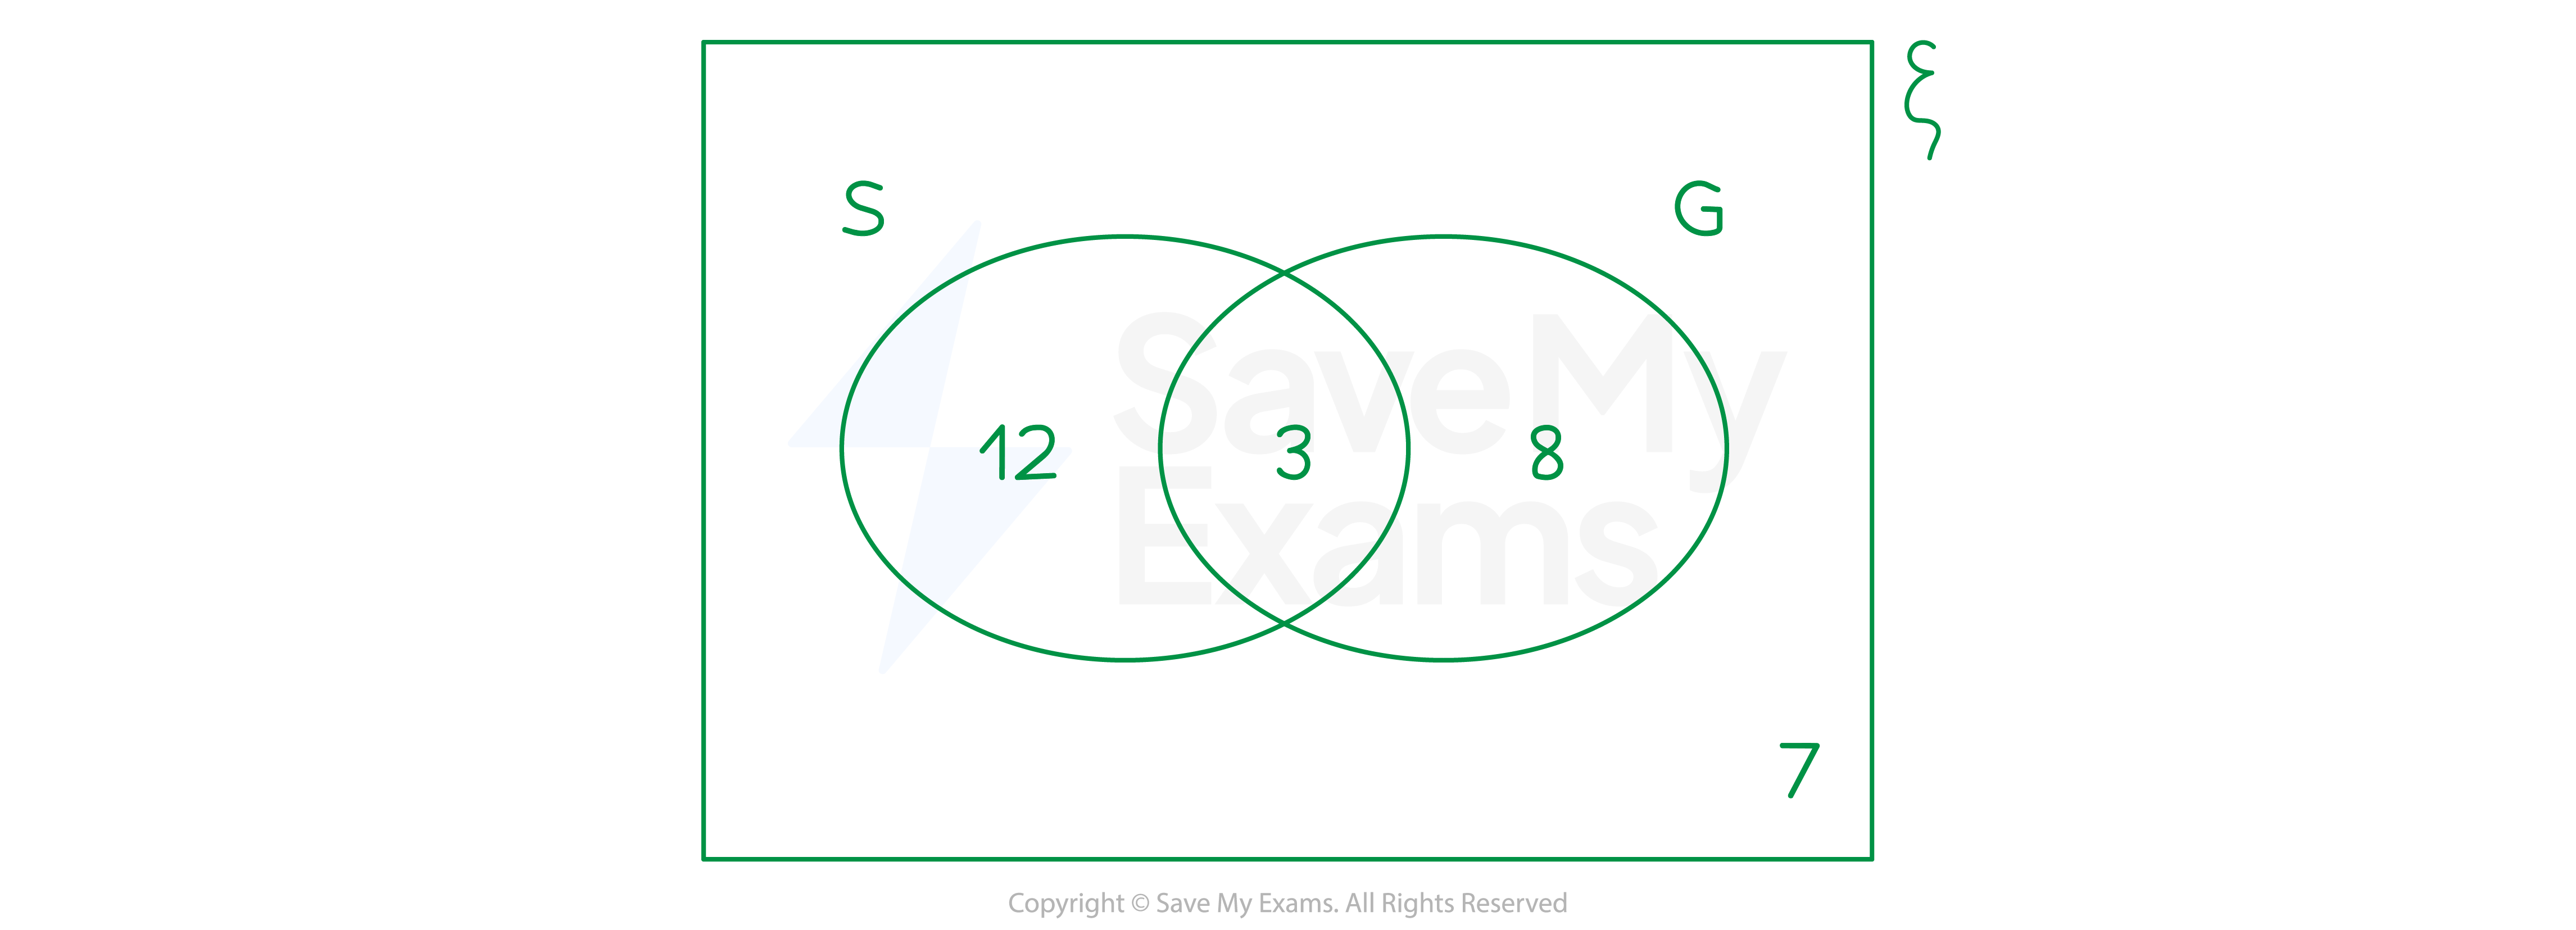
Worked Example In a class of 30 students, 15 students study Spanish and 3 of the Spanish students also study German. 7 students study neither Spanish nor German.
(a) Draw a Venn diagram to show this information.
Answer:
Draw the Venn diagram with its rectangular box and two (labelled) overlapping circles 3 students study both Spanish and German, so start here and work outwards 12 must study Spanish but not German (to get 15 in total for Spanish) 7 study neither, so this goes outside of the circles To get 30 in total, 8 must study German but not Spanish
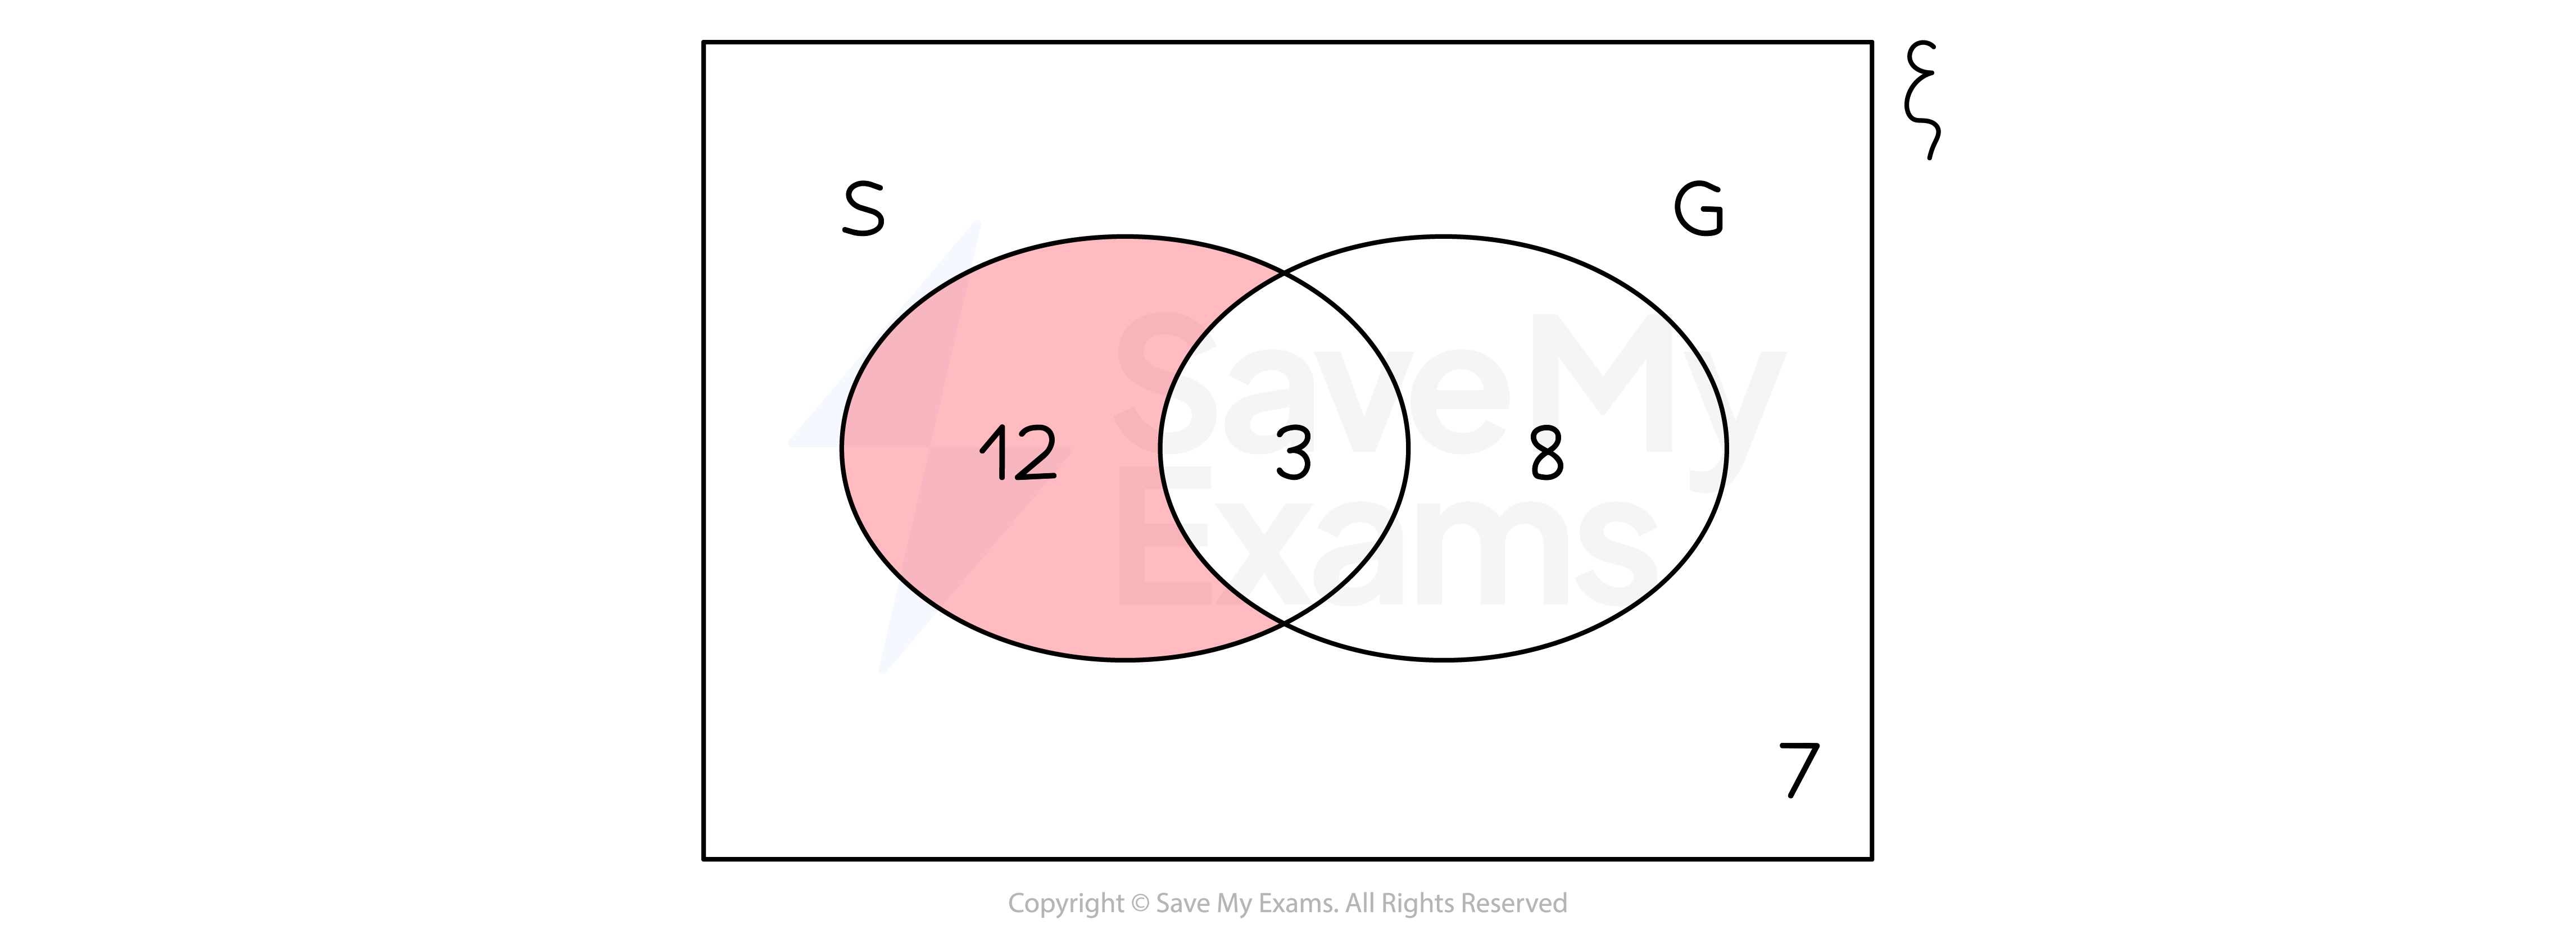
(b) Use your Venn diagram to find the probability that a student, selected at random from the class, studies Spanish but not German.
Answer:
This Venn diagram shows the frequencies in each region
It helps to highlight Spanish but not German
Divide the number of students studying Spanish but not German by the total number of students
Students studying Spanish but not German = 12 Total number of students = 30
Final answer: P(Spanish but not German)
Was this revision note helpful?