13 marksmedium
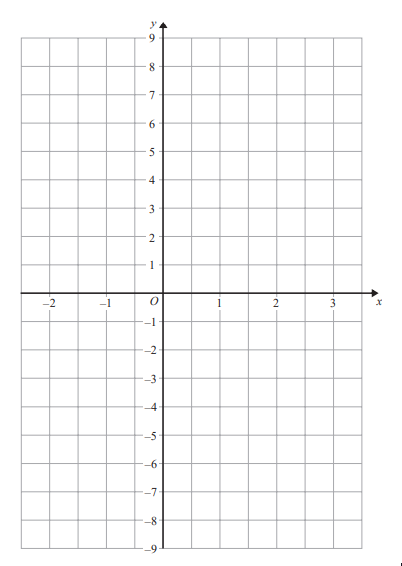
On the grid, draw the graph of for values of from –2 to 3
4 questions · 11 marks · ≈ 11 min
On the grid, draw the graph of for values of from –2 to 3
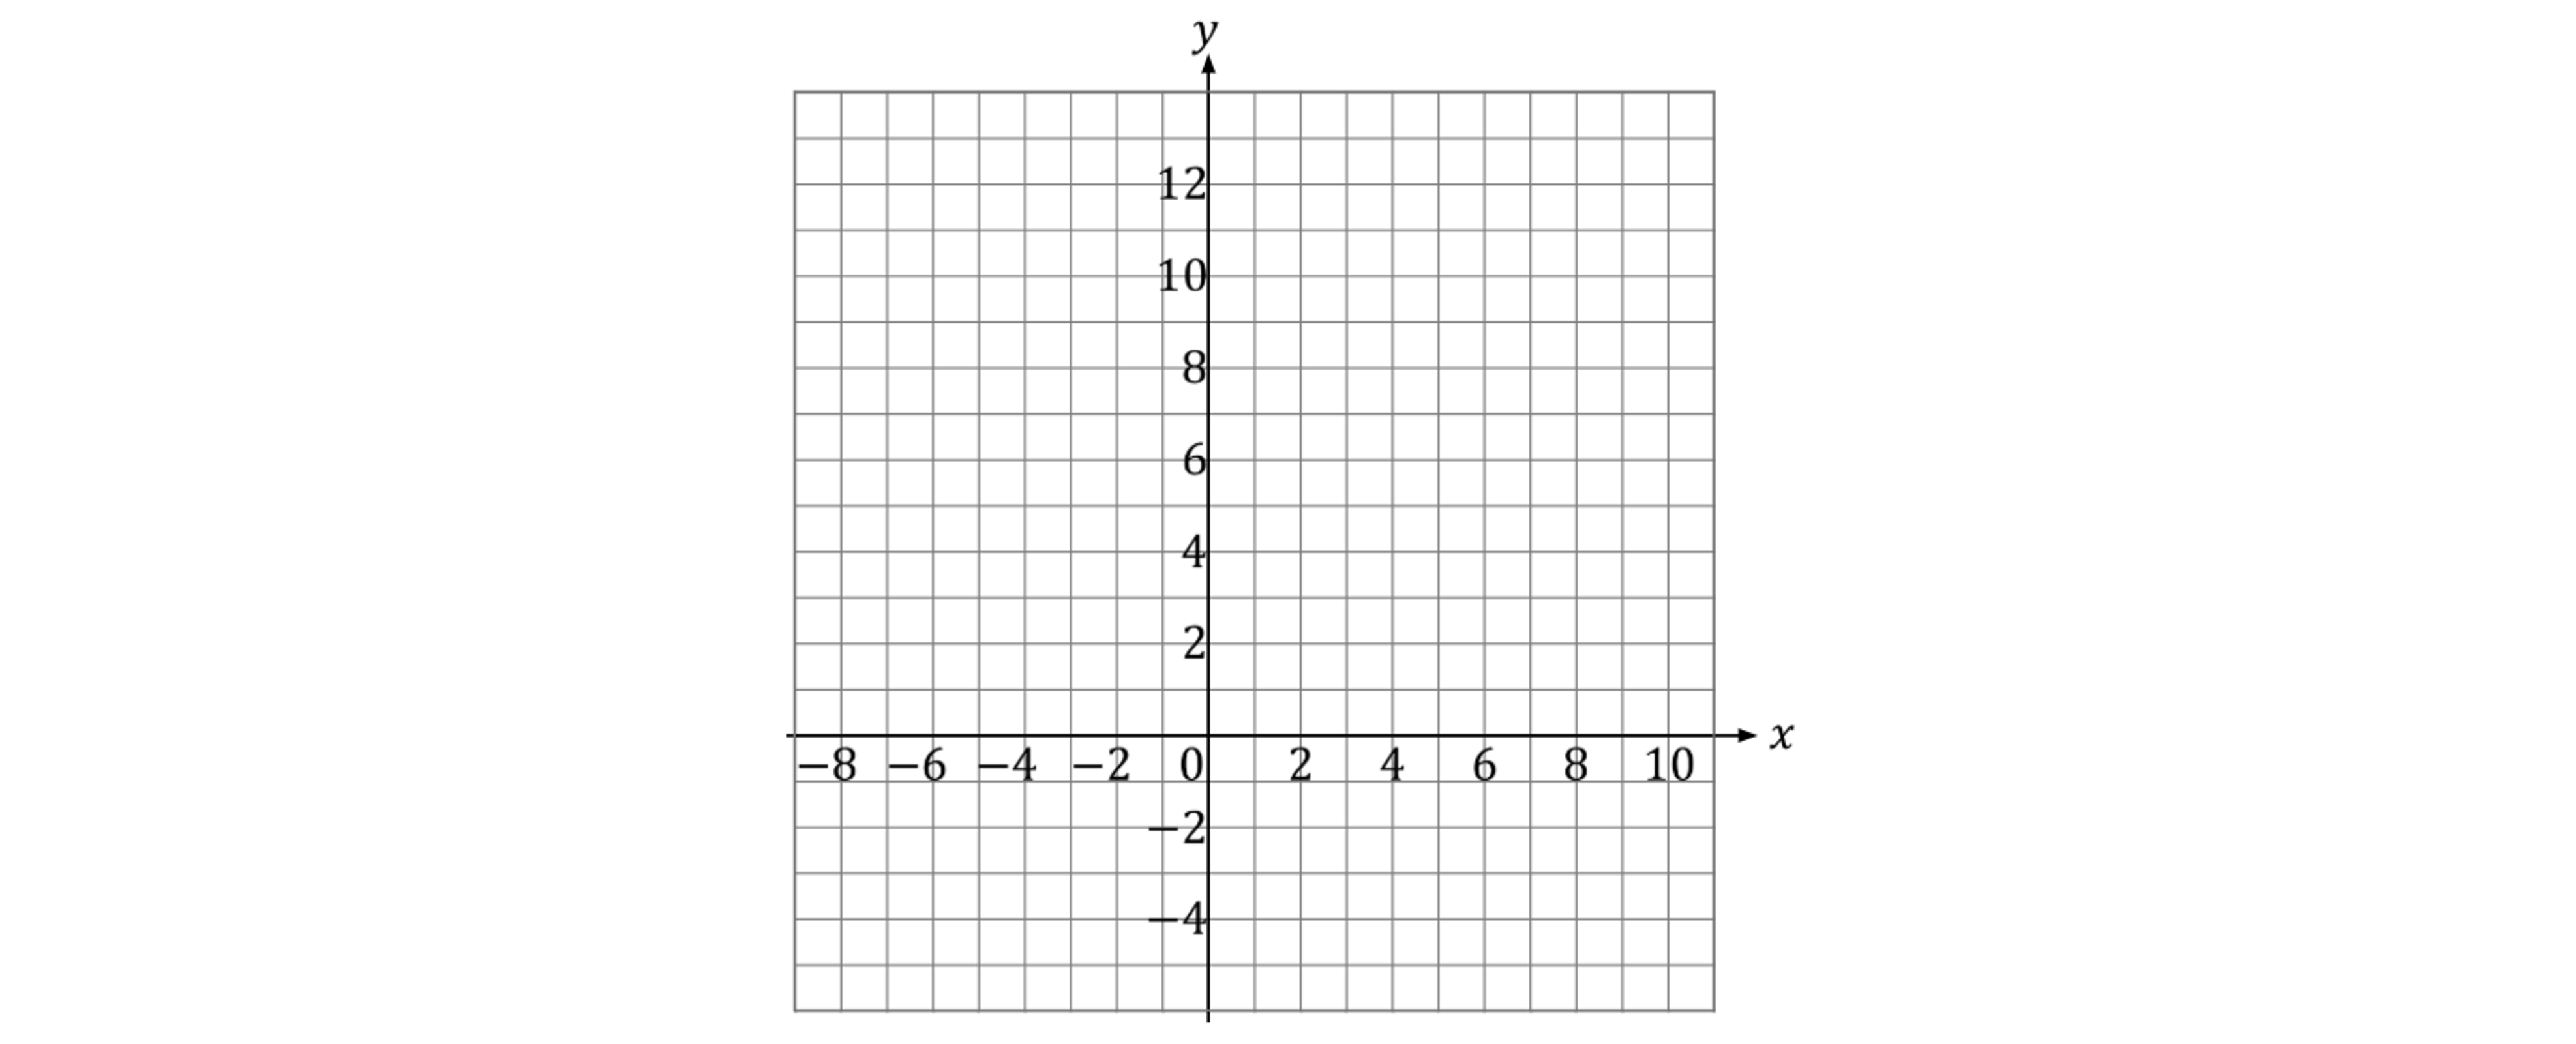
On the grid, draw the graph for values of from -8 to 10.
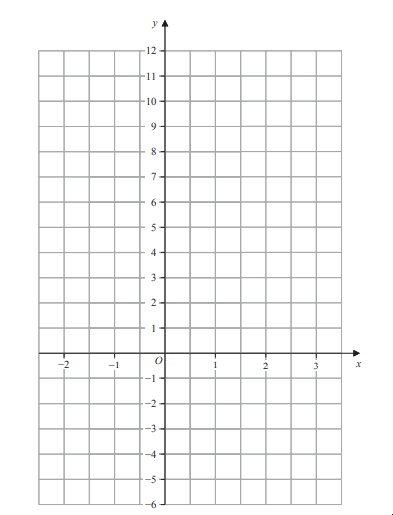
On the grid below, draw the graph of for values of from − 2 to 3
A straight line passes through the points with coordinates (0, –3) and (2, 0) Find an equation of the line.