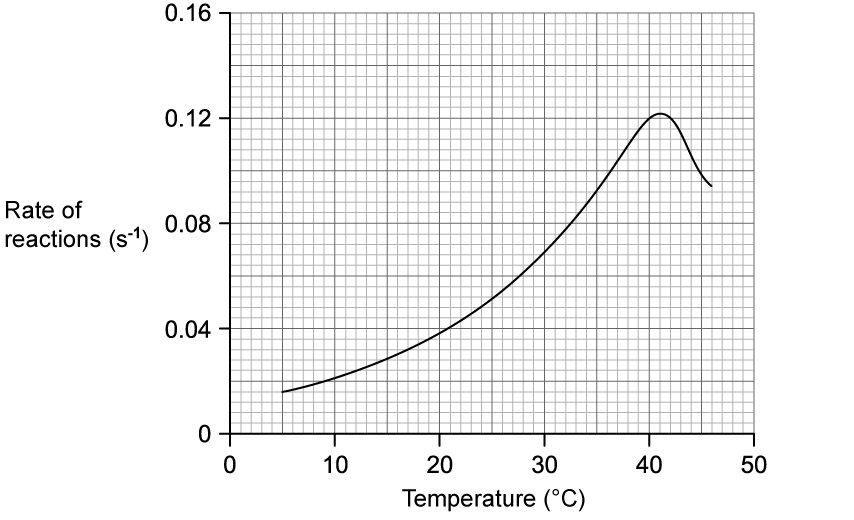
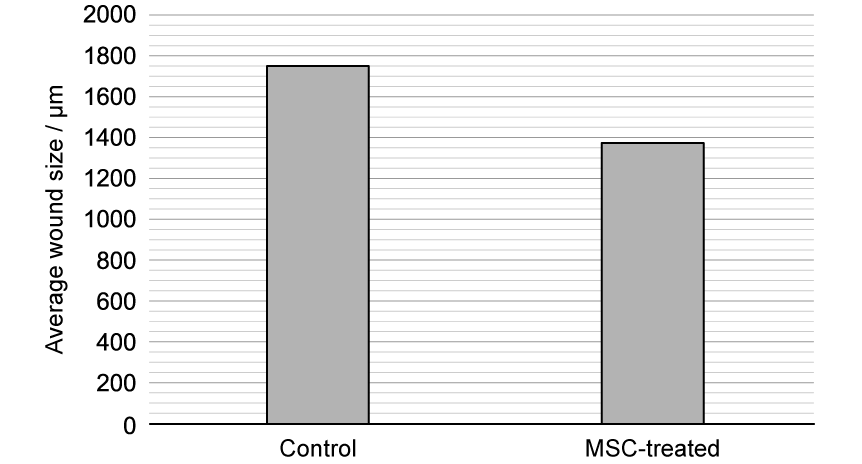
The graph shows the effect of temperature on the activity of an enzyme.
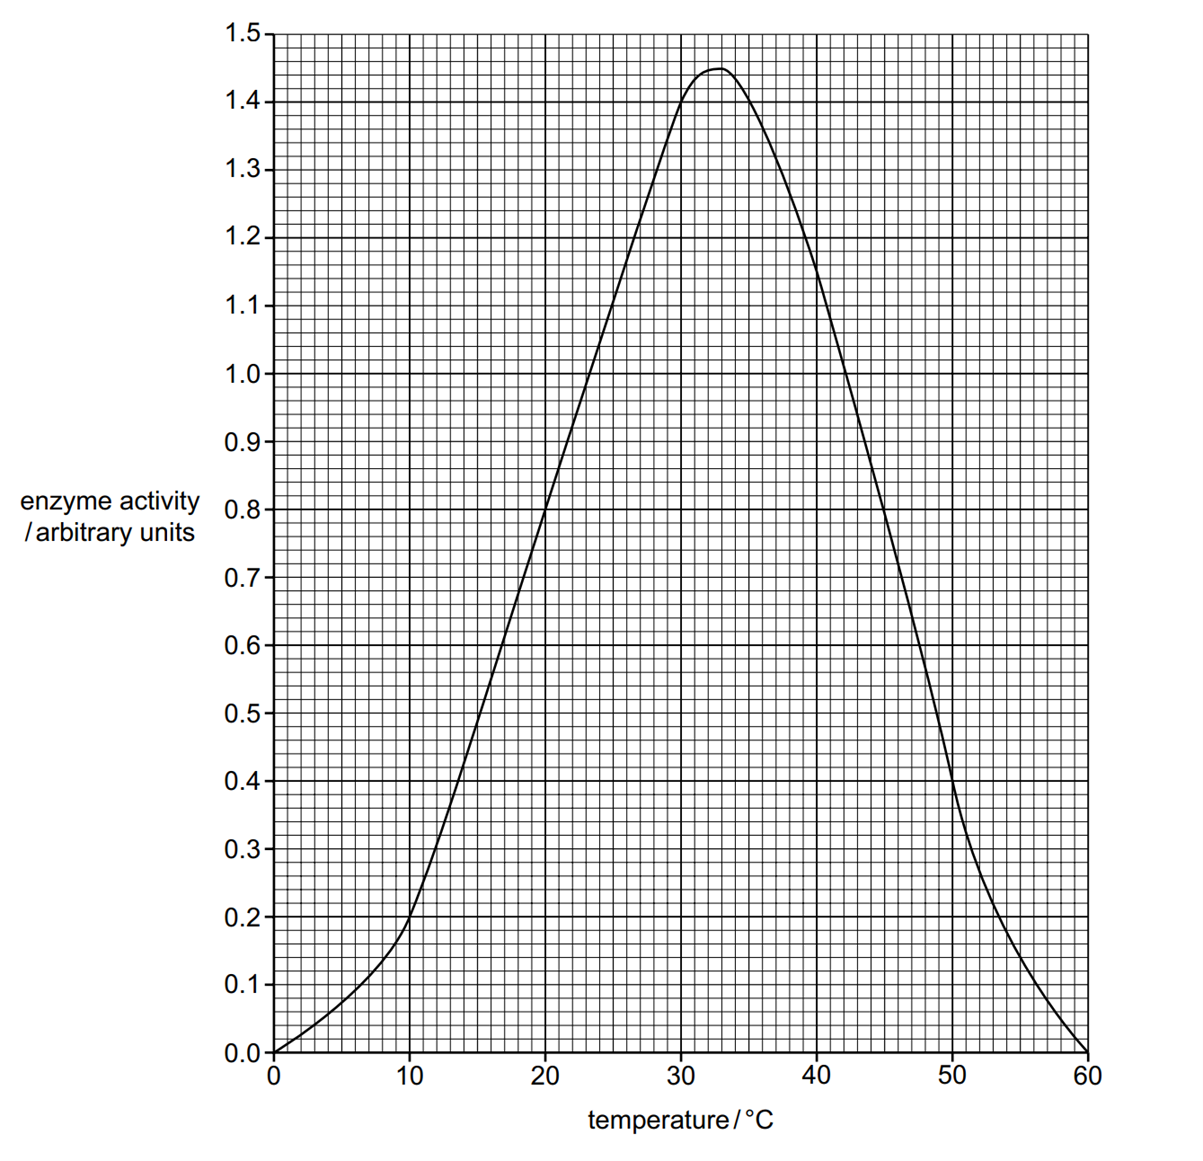
Describe and explain the trend of the graph.
Explain how the evidence from the graph in part (a) indicates that the enzyme being studied is not likely to be one found in the human body.
A group of students wanted to investigate the effect that temperature has on the activity of pepsin, a protease found in the human digestive system.
They used the following method:
- Put 4 cm3 of 1% protein solution into a boiling tube.
- Put 4 cm3 of pepsin solution into a second boiling tube. Put both boiling tubes into a water bath at 20 °C.
- After 4 minutes, add the pepsin solution to the protein solution together in one boiling tube, mixing together with a stirring rod.
- After 20 seconds, add a drop of the mixture to a drop of Biuret solution in one well of a spotting tile.
- Repeat step 5 until the Biuret solution no longer changes colour.
- Repeat steps 1 – 6 at 10 °C (using an ice water bath), 30 °C, 40 °C and 50 °C.
Explain why the student left the protein and pepsin solutions in the water bath for 4 minutes in step 3.
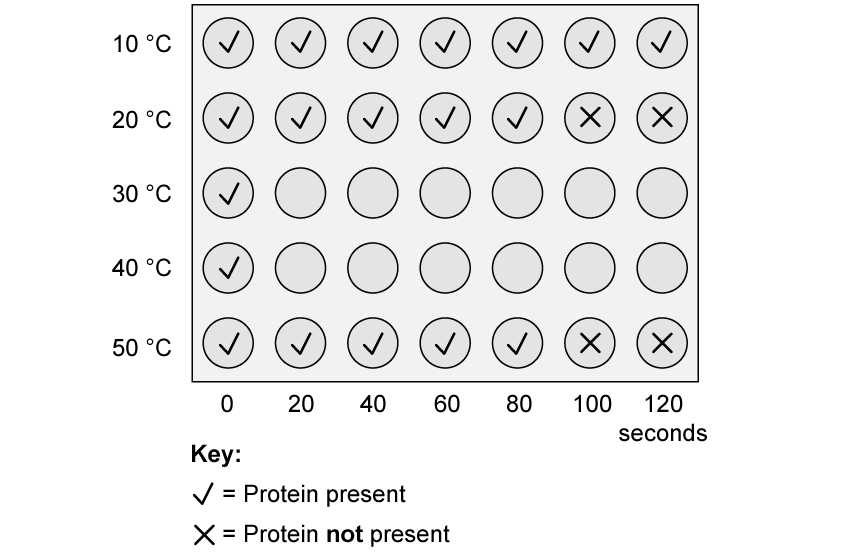
The image below shows the incomplete results of the experiment carried out in part (c).
Complete the image below to show the results you would expect at 30 °C and at 40 °C
You should write a tick or a cross in each well of the spotting tile.
State where in the digestive system protease is secreted.