Venn Diagrams with Conditional Probability (Edexcel IAL Maths)
Exam board Pearson Edexcel · IALUpdated 2026-07-02
Further Venn Diagrams
Spec point —
3.4
Venn diagrams with conditional probability
How do I find conditional probabilities from a Venn diagram?
-
Interpreting questions in terms of OR (), AND (),complement ( ‘ ) and “given that” ( | )
-
Conditional probability may now be involved too
-
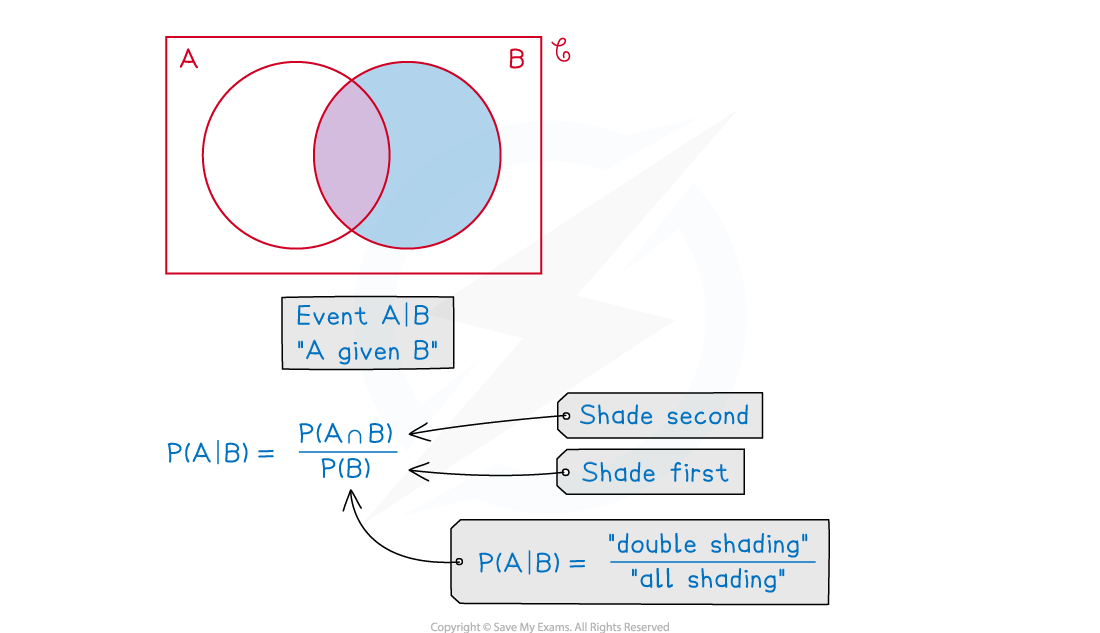
Use mini-Venn diagrams to sketch and shade the regions you are dealing with – use different colours if available or different styles of shading if not
- Shading can help you see the answer
-
since shade B first, then shade
- the answer will then be
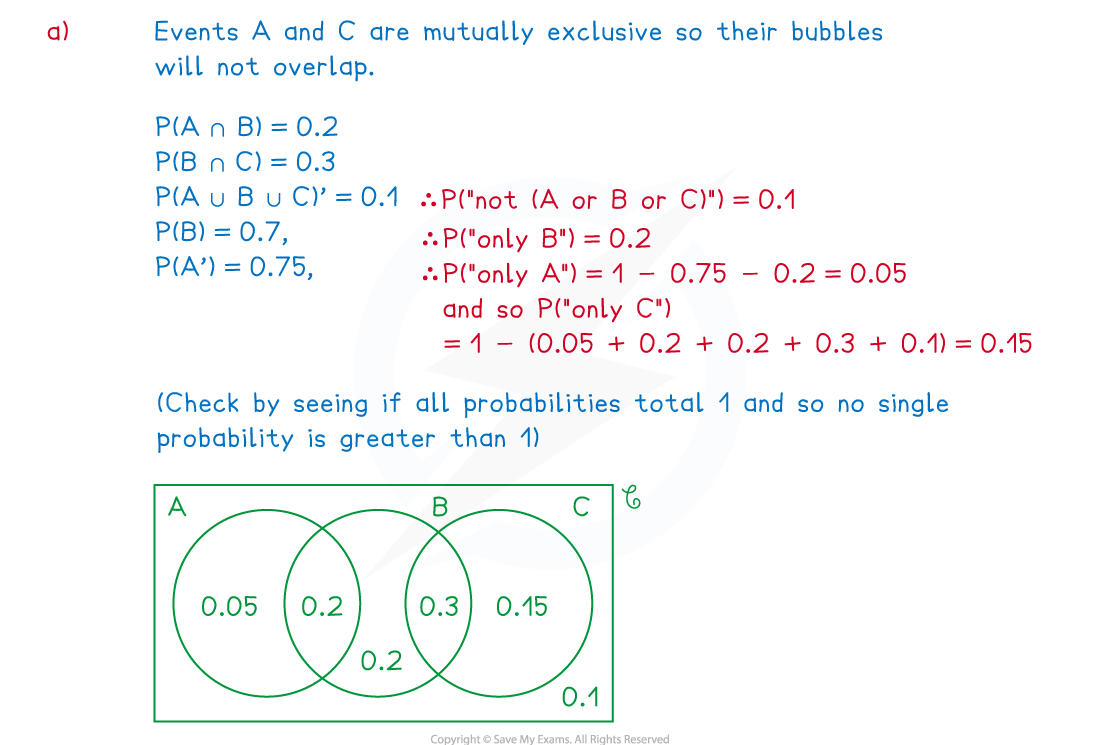
Worked Example Three events, and are such that
events and are mutually exclusive
(a) Draw a complete Venn diagram to show the probabilities connecting the three events.
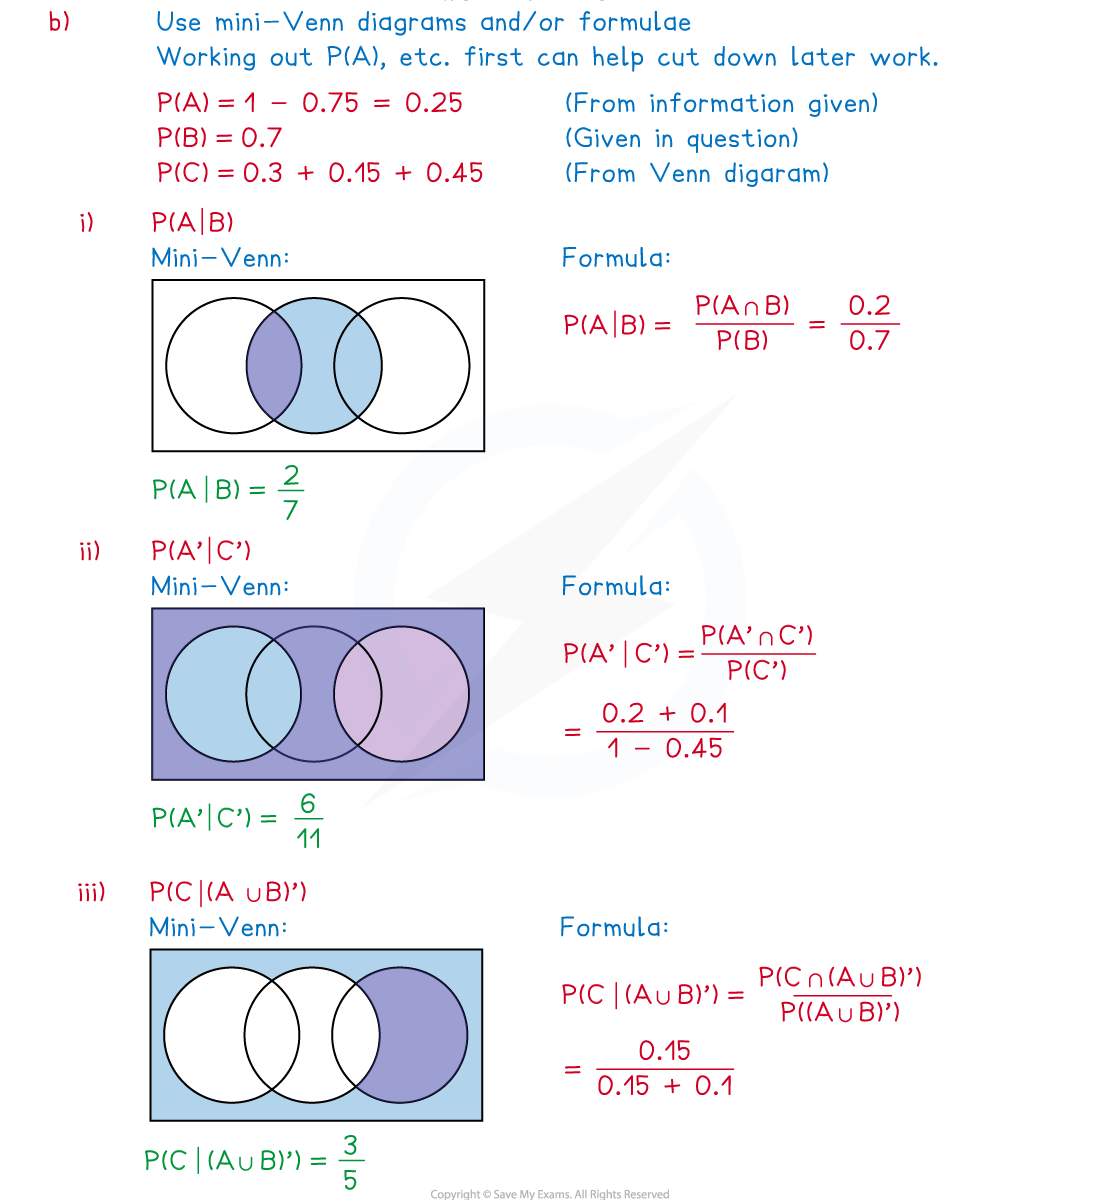
(b) Find
(i)
(ii)
(iii)
Answer:
Exam Hint
- Always draw the box in a Venn diagram; it represents all possible outcomes of the experiment so is a crucial part of the diagram, the bubbles merely represent the events we are particularly interested in
- You may be able to answer some questions by applying formulae or you may prefer to use shaded mini-Venn diagrams; complicated questions tend to be easier with mini-Venn diagrams
Was this revision note helpful?
Build on this topic