14 markseasy
1 mark
A class is asked to collect a sample of bivariate data. They collect data on the shoe size, S, and the arm span, A cm, of 20 randomly selected boys from the class.
Explain what is meant by the term ‘bivariate data’.
3 marks
The class plot the data in a scatter diagram and find the equation of the regression line of* A* on S to be A=4.5 S + 133. These are both plotted in the diagram below.
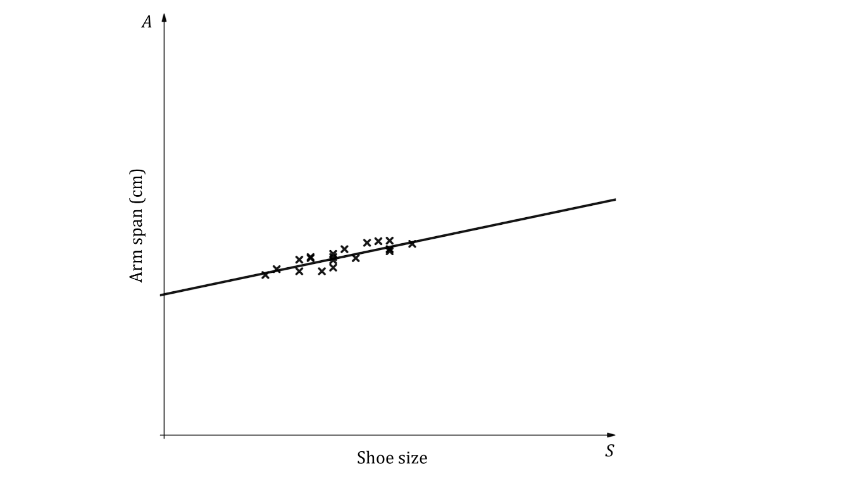
(i) Interpret the value 4.5 in the context of the question.
(ii) Interpret the value 133 in the context of the question.
(iii) Explain how the sign of the coefficient of S in the equation is related to the correlation shown in the scatter diagram.