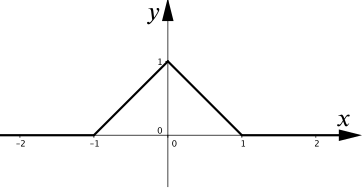
A graph of the function y=f(x) is sketched on the axes below;
The value of ∫−11f(x2−1)dx equals (a) 41 (b) 31 (c) 53 (d) 32.
Suggestion
Can we write down an equation for f(x) for each distinct interval?
Can we then write down what f(x2−1) is?
If the values of x run from −1 to 1, what values does x2−1 run through?
Solution
A graph of the function y=f(x) is sketched on the axes below;
The value of ∫−11f(x2−1)dx equals (a) 41 (b) 31 (c) 53 (d) 32.
We can write the function as f(x)=⎩⎨⎧x+1,1−x,0,−1≤x≤0;0≤x≤1;otherwise.
By substituting we can say, f(x2−1)=⎩⎨⎧x2−1+1=x2,1−x2+1=2−x2,0,−1≤x2−1≤0;0≤x2−1≤1;otherwise.
The first of these intervals can be rewritten, −1≤x2−1≤0⟹0≤x2≤1⟹−1≤x≤1. We only need to integrate over this interval, so we do not need to worry about the second interval.
So we have ∫−11f(x2−1)dx=∫−11x2dx=[3x3]−11=32 and the answer is (d).
There are two intervals that we are interested in, −1≤x≤0, and 0≤x≤1 (everywhere else the function f(x) is zero). The inequality −1≤x≤0 becomes on squaring 1≥x2≥0, and so 0≥x2−1≥−1. The inequality 0≤x≤1 becomes on squaring 0≤x2≤1, and so −1≤x2−1≤0. These intervals are the same, so we can simply focus on what happens to f(x2−1) for x on the interval [−1,0]. On this domain, f(x)=1+x, and so f(x2−1)=1+x2−1=x2. Thus ∫−11f(x2−1)dx=∫−11x2dx=[3x3]−11=32 and so the answer is (d). An alternative approach could be to draw up a table. x-2-1.5-1-0.500.511.52 x2−131.250-0.75-1-0.7501.253 f(x2−1)0010.2500.25100 Plotting these points strongly suggests we are interested in the area under y=x2 between −1 and 1.