Speed-Time Graphs (Cambridge International IGCSE Mathematics)
Exam board Cambridge International · IGCSEUpdated 2026-01-19
Speed-time graphs
How do I use a speed-time graph?
-
Speed-time graphs show the speed of an object at different times
- Speed is on the vertical axis
- Time is on the horizontal axis
-
Straight lines
- with positive gradients represent objects speeding up (accelerating)
- with negative gradients represent objects slowing down (decelerating)
-
Horizontal lines indicate moving at a constant speed
- The object is neither speeding up or slowing down
- If the constant speed is zero, then it at rest
Exam Hint Always check the vertical axis to see if you are given a speed-time graph or a distance-time graph!
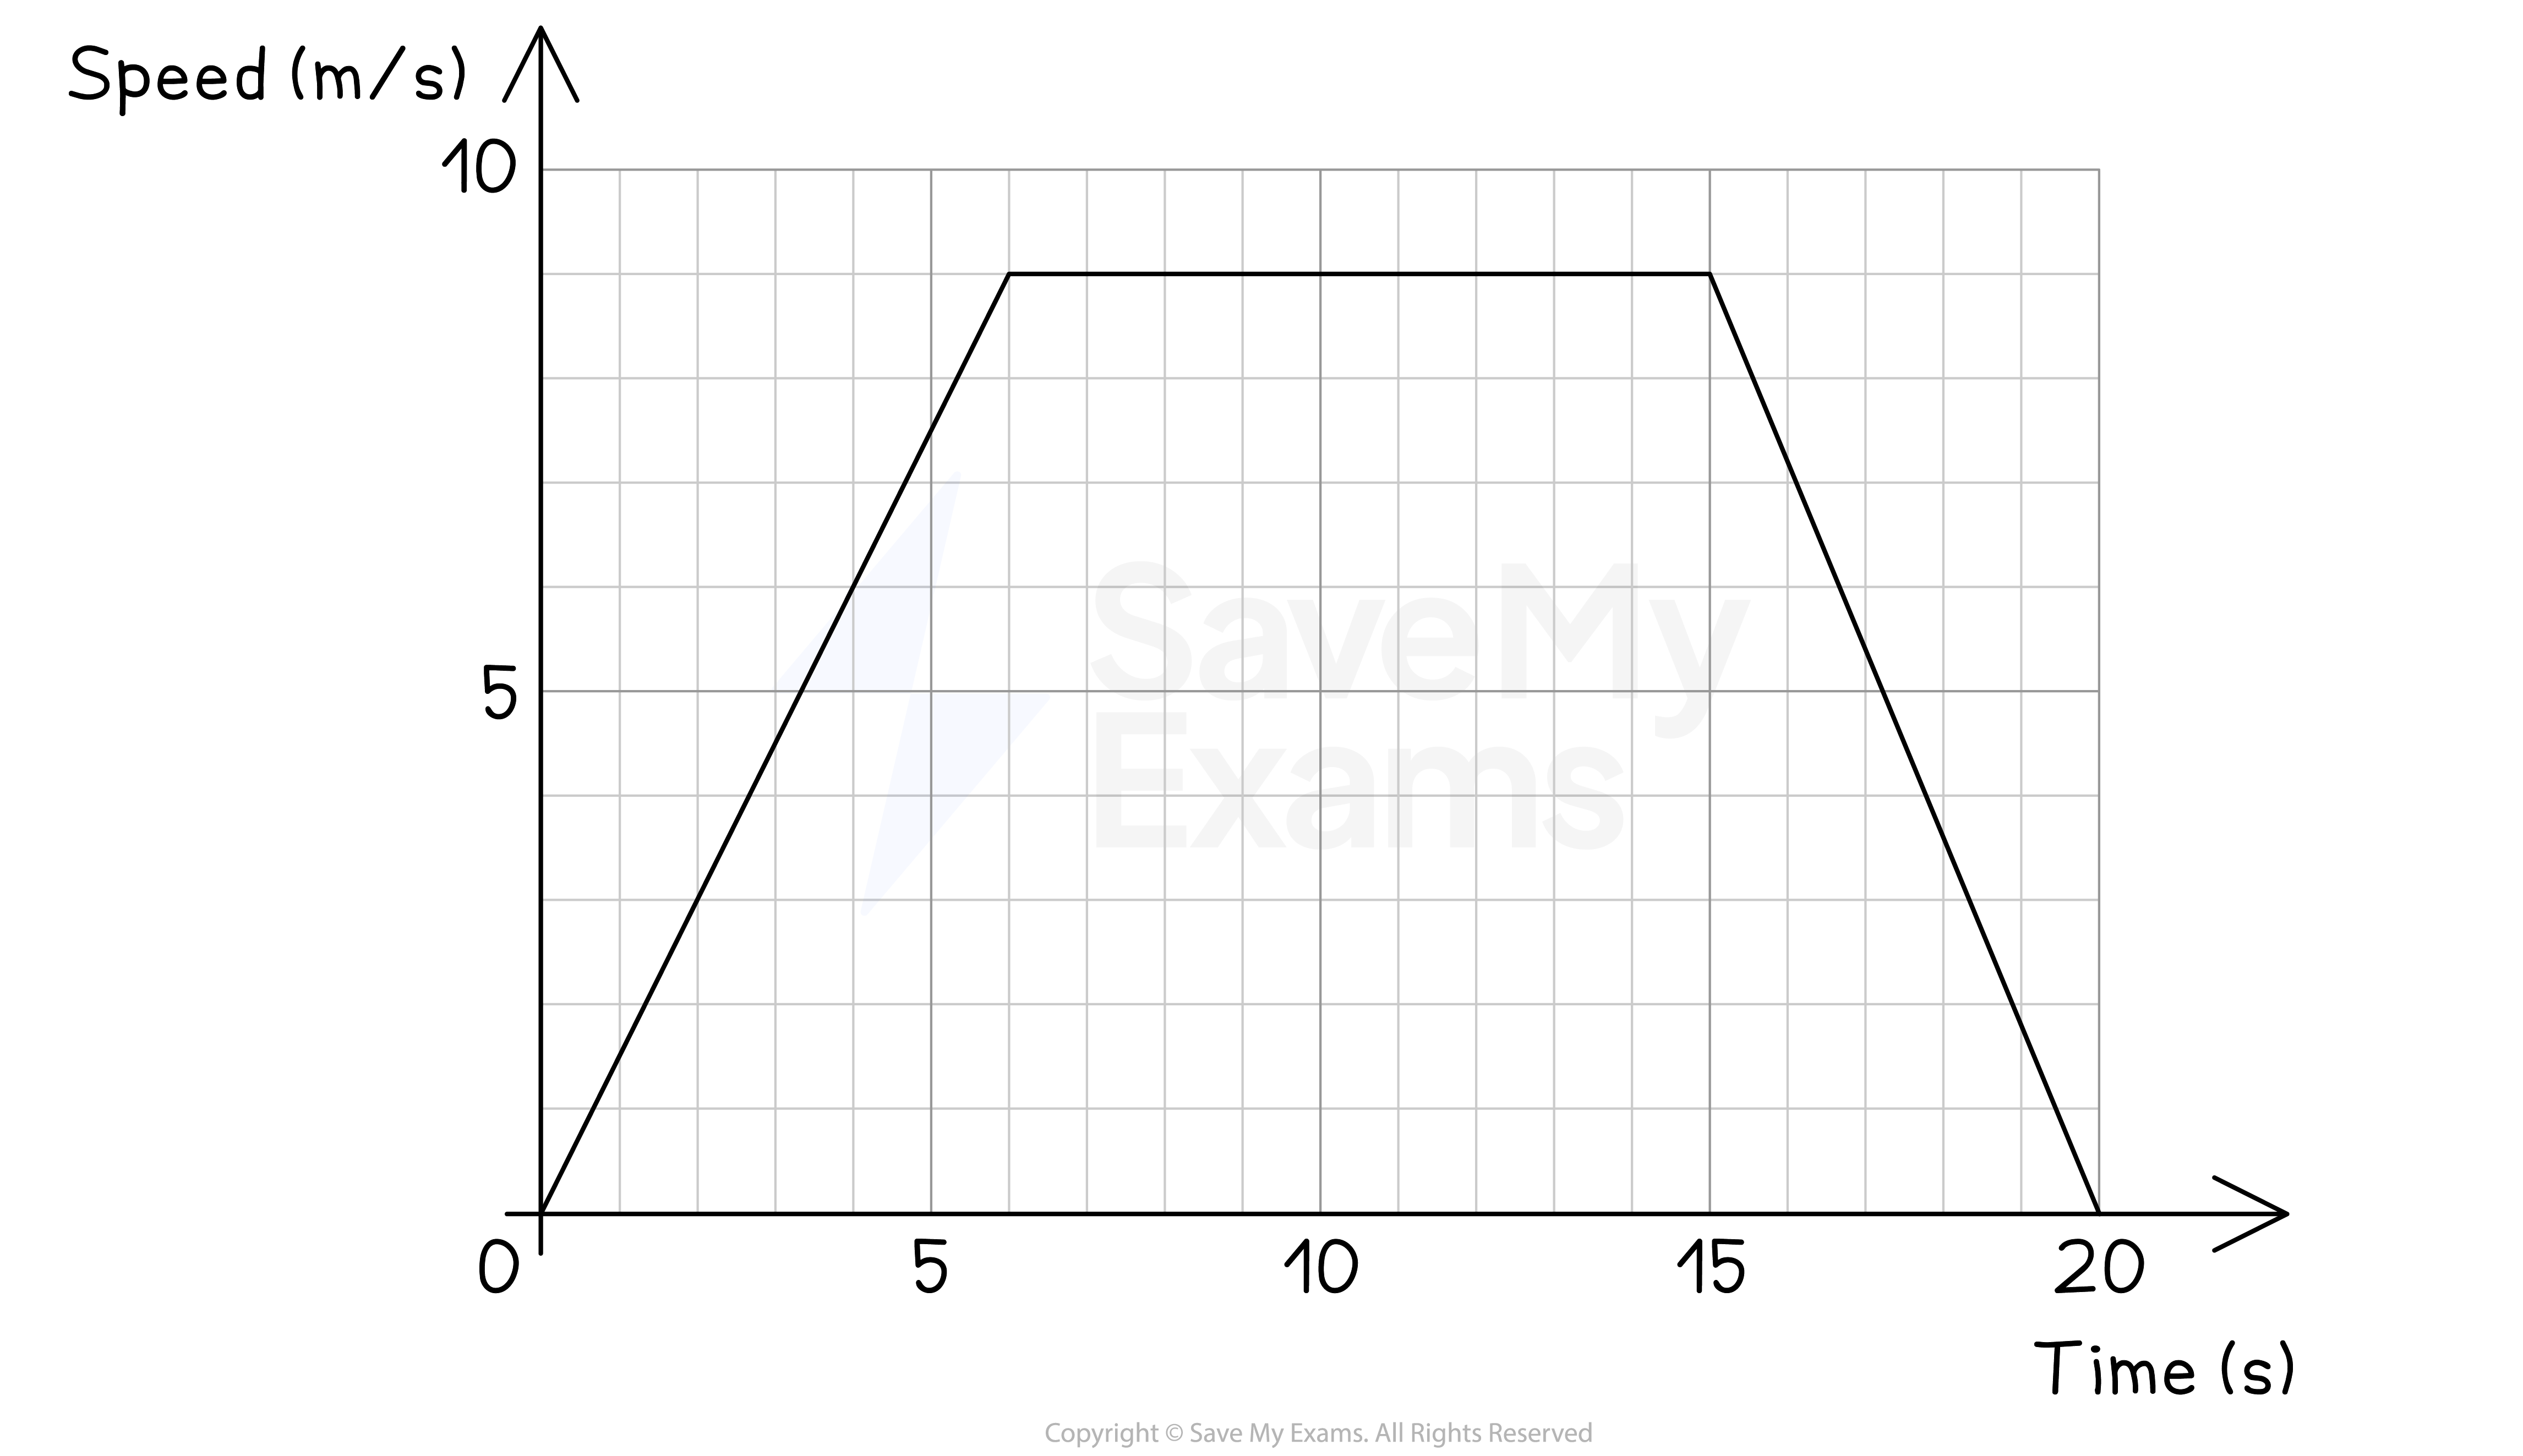
Worked Example The speed-time graph for a car travelling between two sets of traffic lights is shown.
For how long was the car travelling at a constant speed?
Answer:
Constant speed is represented by horizontal lines
There is a horizontal line from 6 seconds to 15 seconds
15 - 6 = 9
Final answer: 9 seconds
Was this revision note helpful?
Build on this topic