Factors influencing population structures (Cambridge International IGCSE Geography)
Specification link
This page covers section 6.2.1 of the CIE IGCSE specification .
- 6.2.1- Factors influencing population structures: natural increase and net migration.
Population pyramids
Spec point — "Candidates should be able to: • select, present, construct and communicate data through appropriate graphs, charts and diagrams using relevant scales and annotations to present information • extract, interpret, analyse and evaluate information presented on graphs, charts and diagrams • identify and evaluate variations, trends and patterns from data provided."
Population pyramids
-
The characteristics of a population—the distribution of age, sex, ethnicity, religion, etc.—are known as the population structure
-
Information about these characteristics is gathered in a census
-
The population structure is the result of changes in:
- fertility
- mortality
- migration
-
The two main components of age and sex can be shown on a population pyramid
What is a population pyramid?
-
Population pyramids (also known as an age structure graph) are used to display the gender and age structure of a given population
- They illustrate the distribution of the population across age groups and between male and female
-
They enable governments nationally and regionally to assess the needs of the population for services such as healthcare and education
- This means the governments can estimate and plan for spending
-
As countries develop and pass through the stages of demographic transition, the shape of the population pyramid changes
- Each bar of the population pyramid represents a 5-year age range
- The two sides of the population pyramid represent males (usually on the left) and females (usually on the right)
-
The population pyramid can be used to identify the following groups:
- Young dependants
- Old dependants
- Economically active(working population)
- Dependency ratio
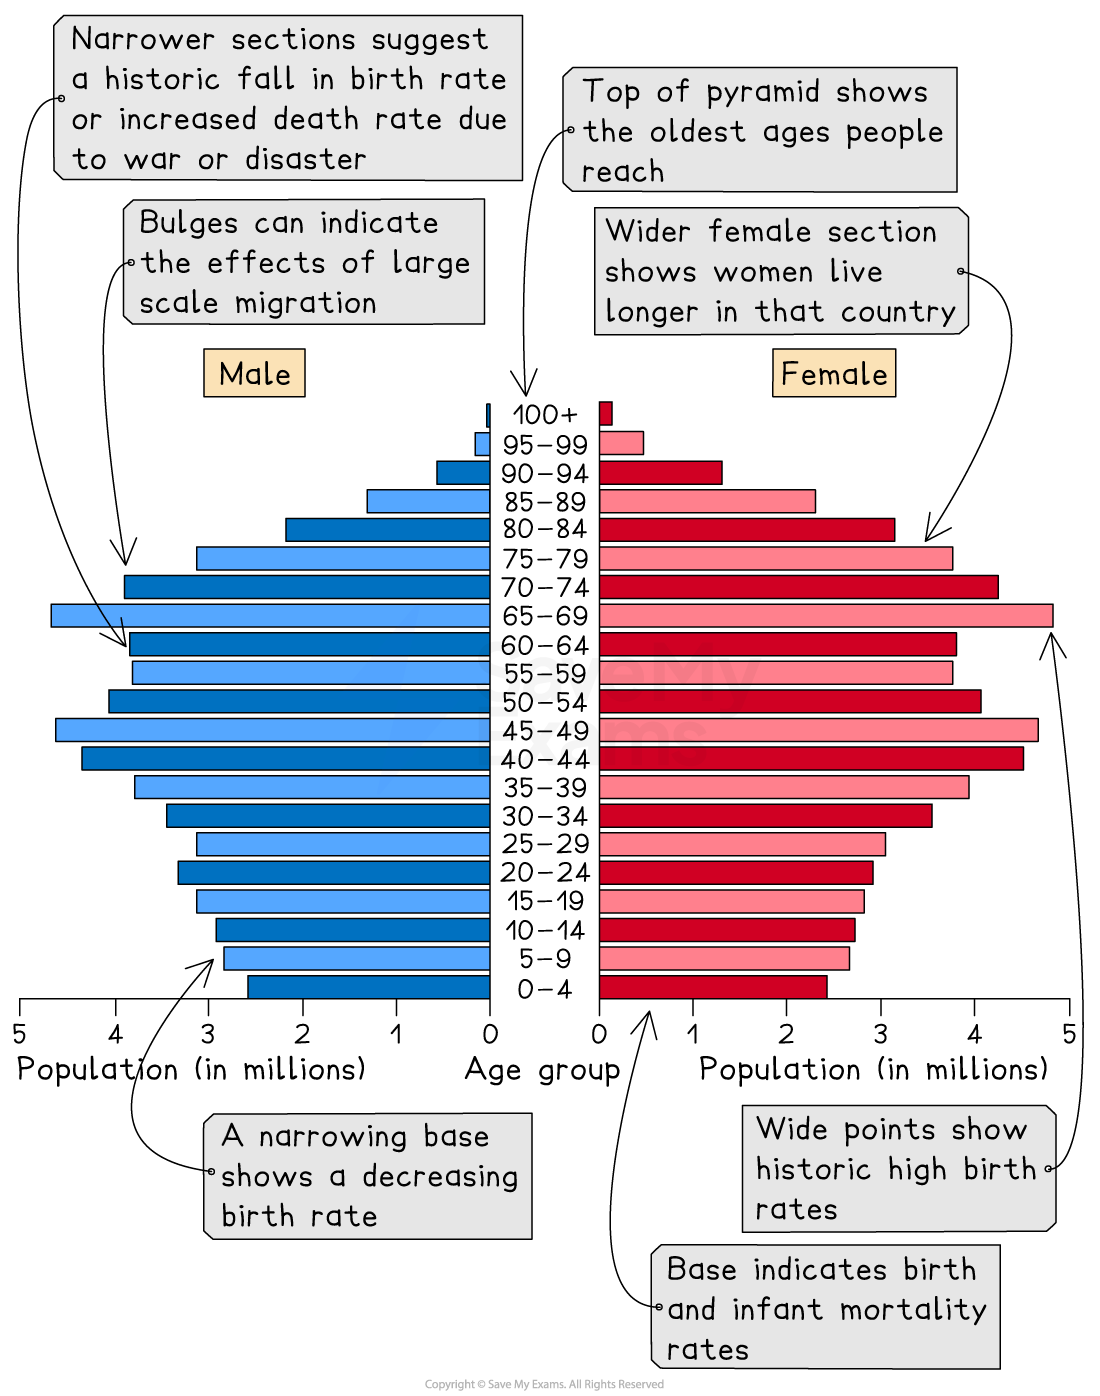
Interpreting a population pyramid
Demographic transition and population structure
- As countries move through the stages of demographic transition
- The shape of the population pyramids reflect the changes
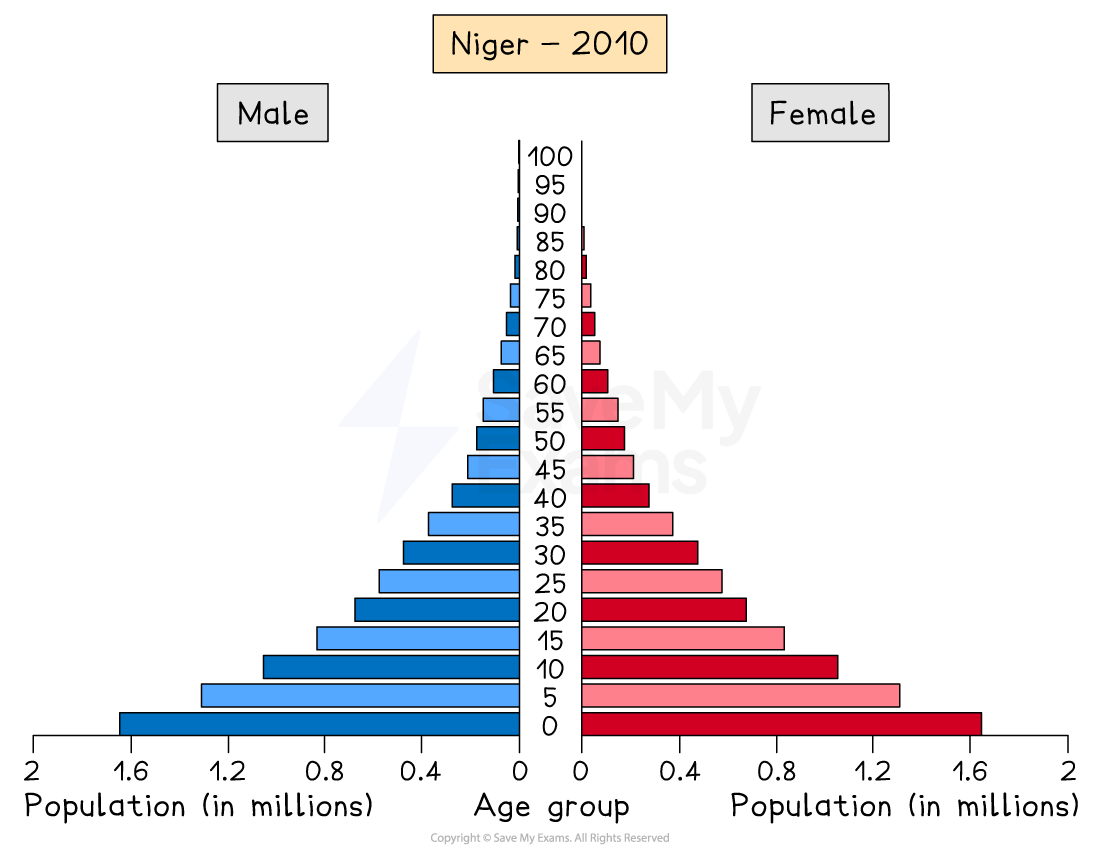
Population pyramid of Niger 2010
-
LEDCs like Niger have a concave pyramid shape
-
Stages 1 and 2 of the model indicate:
- high birth rate
- low life expectancy
- high death rate but starting to decrease
- high infant mortality rate
- a young dependent population dominates
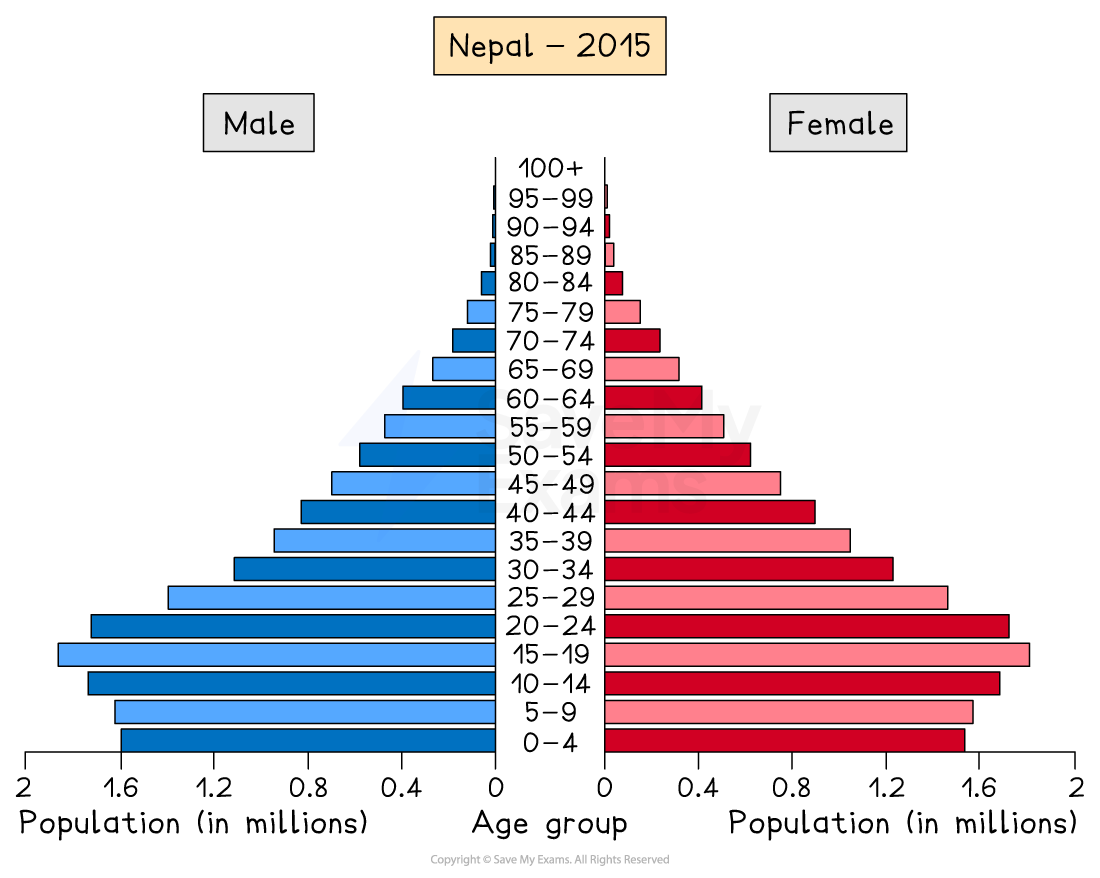
Population pyramid of Nepal
-
LEDCs/NICs that are a little further along the demographic transition, such as Nepal, have a convex pyramid shape
-
Stage 3 of the demographic transition model
-
This indicates:
- decreasing birth rate
- increasing life expectancy
- decreasing death rate
- decreasing infant mortality
- larger working-age population
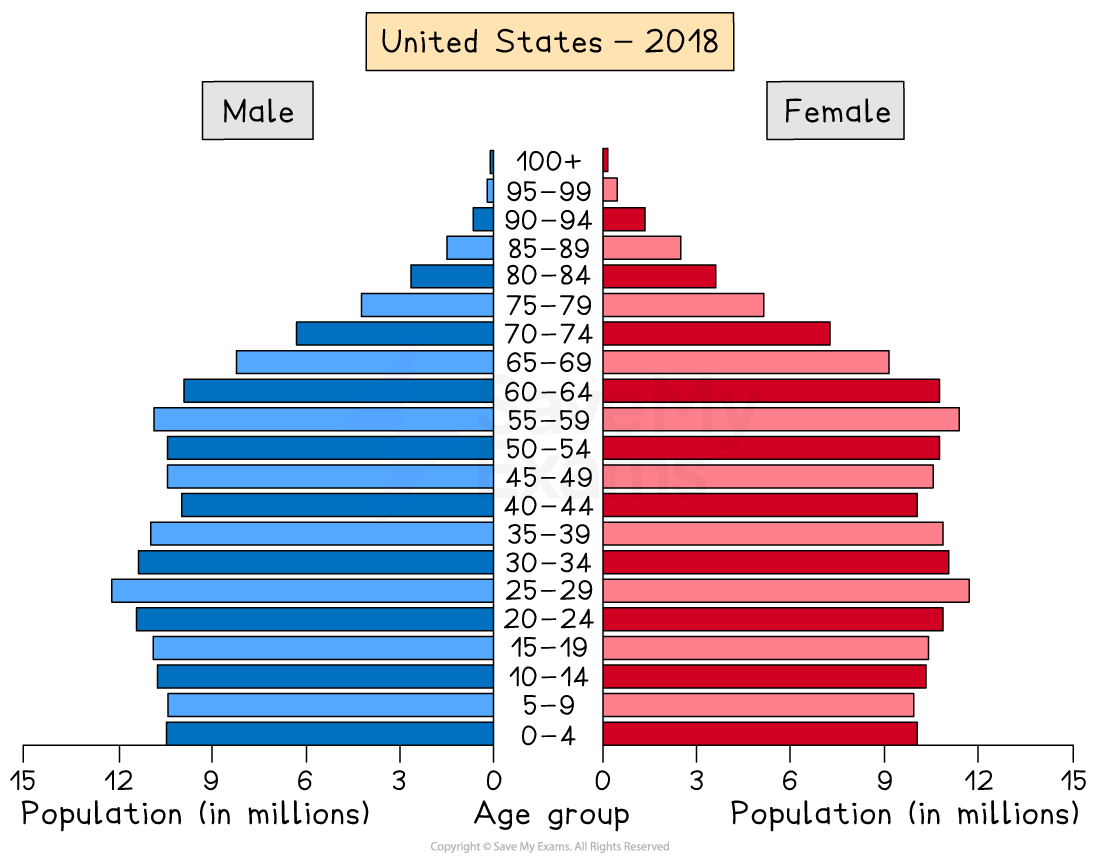
Population pyramid of the USA
-
MEDC countries such as the USA have a column-shape
-
Stage 4 of the demographic transition model
-
This indicates:
- decreasing birth rate
- increasing life expectancy
- decreasing death rate
- low infant mortality
- larger working-age population
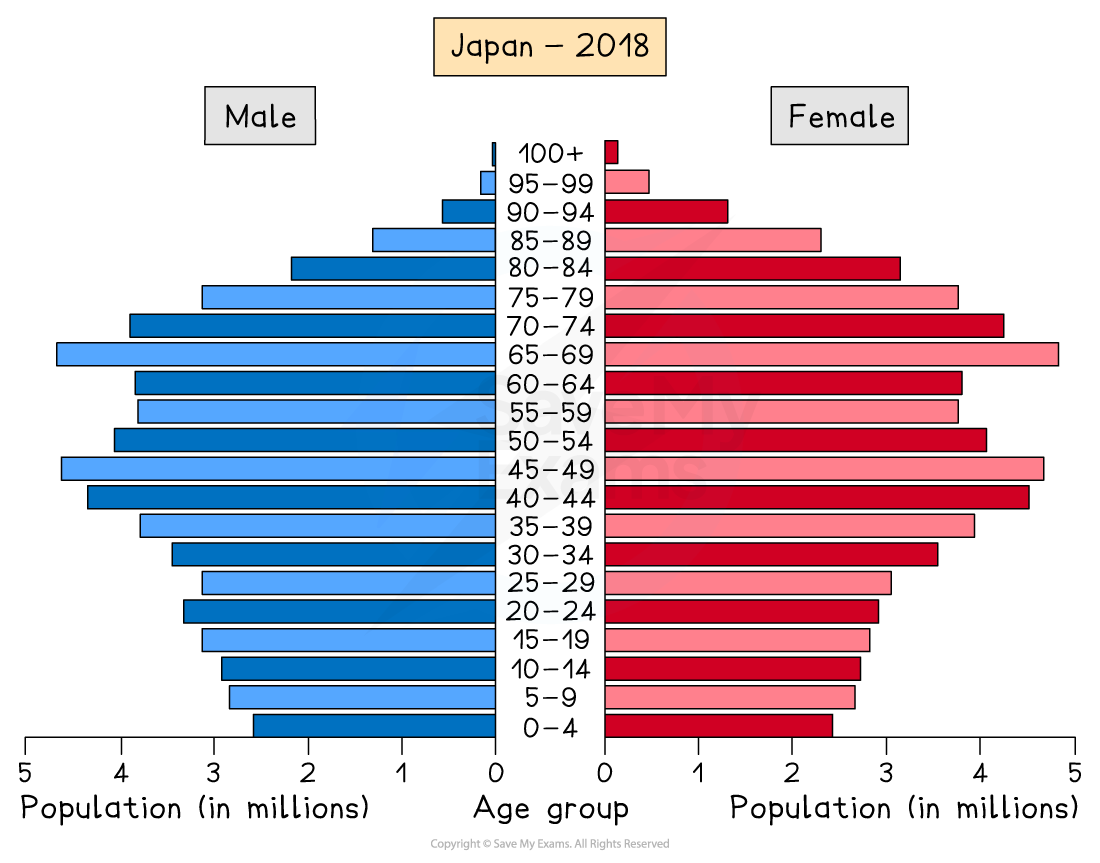
Population pyramid of Japan
-
MEDC countries such as Japan have a pentagon shape with a narrowing base
-
Stage 5 of the demographic transition model
-
This indicates:
- Decreasing birth rate
- Increasing life expectancy
- The death rate is higher than the birth rate due to the ageing population
- Low infant mortality
- Ageing population: older dependent population
Natural increase
Spec point — Factors influencing population structures: natural increase and net migration.
-
Natural increase is calculated by subtracting the death rate from the birth rate
-
The combination of a decreasing death rate and high birth rate led to rapid natural increase and population explosion
-
The impacts on population structure often leads to
- a larger overall population
- a population with a larger proportion of younger people
- a higher dependency ratio
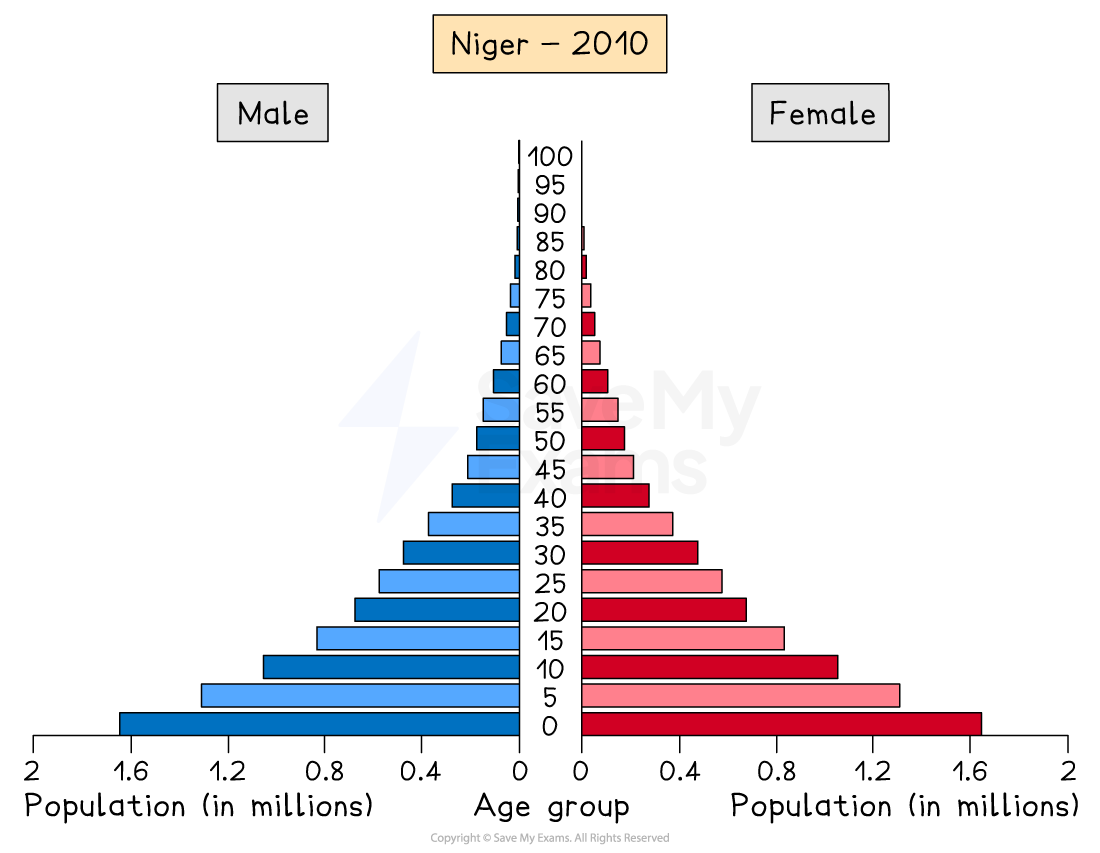
Population structure of Niger
-
A negative rate of natural increase happens when the birth rate is lower than the death rate
-
When this occurs, it impacts the population structure, leading to:
- a shrinking population
- an ageing population
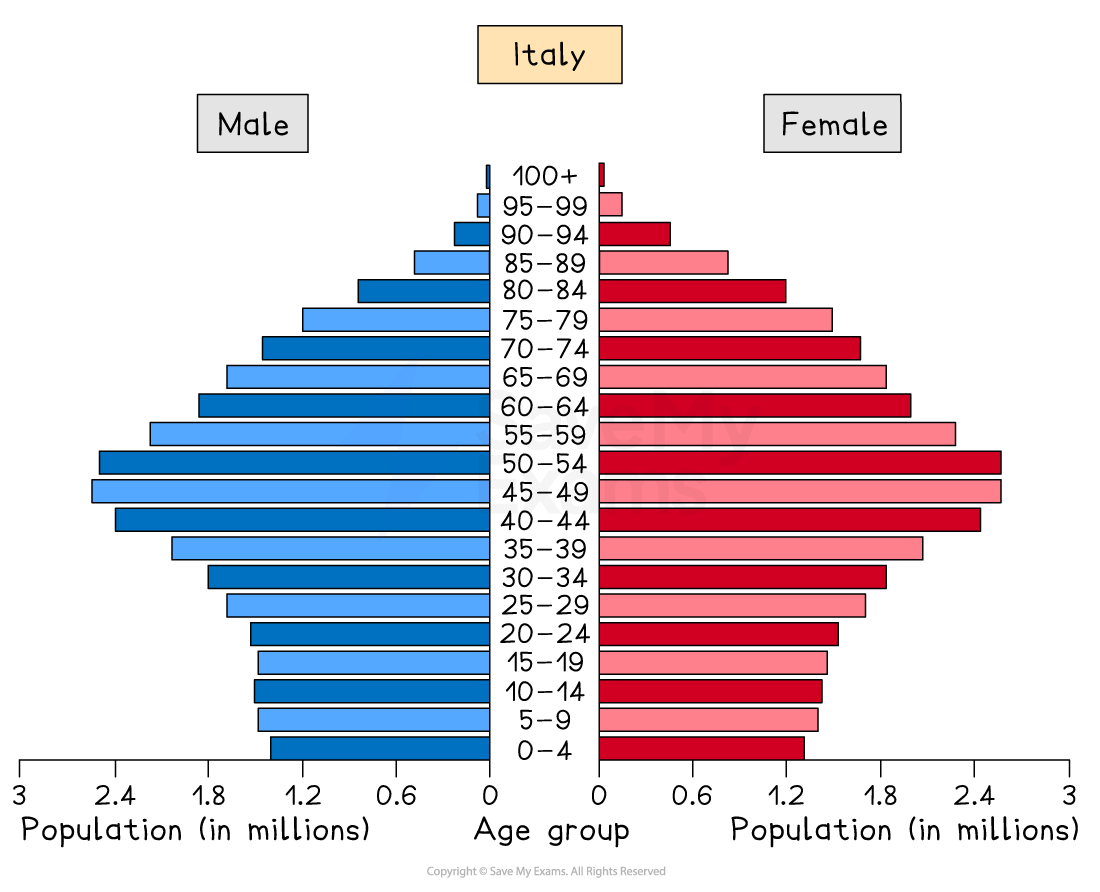
Population structure of Italy
Net migration
Spec point — Factors influencing population structures: natural increase and net migration.
-
Net migration is calculated by subtracting the number of emigrants from the number of immigrants
- The measurement is given per 1000 people
-
Positive net migration occurs when there are more immigrants into a country than there are emigrants from the country
-
Negative net migration occurs when there are more emigrants from a country than there are immigrants into the country
-
In some countries, migration can lead to an imbalance in the population structure
-
The UAE has significantly more males than females
-
Approximately 29% of the population are males between the ages of 25 and 39, whereas only 10.5% of the population are women between 25 and 39
- This is the result of the migration of males to the UAE to work in the oil, gas and construction industries
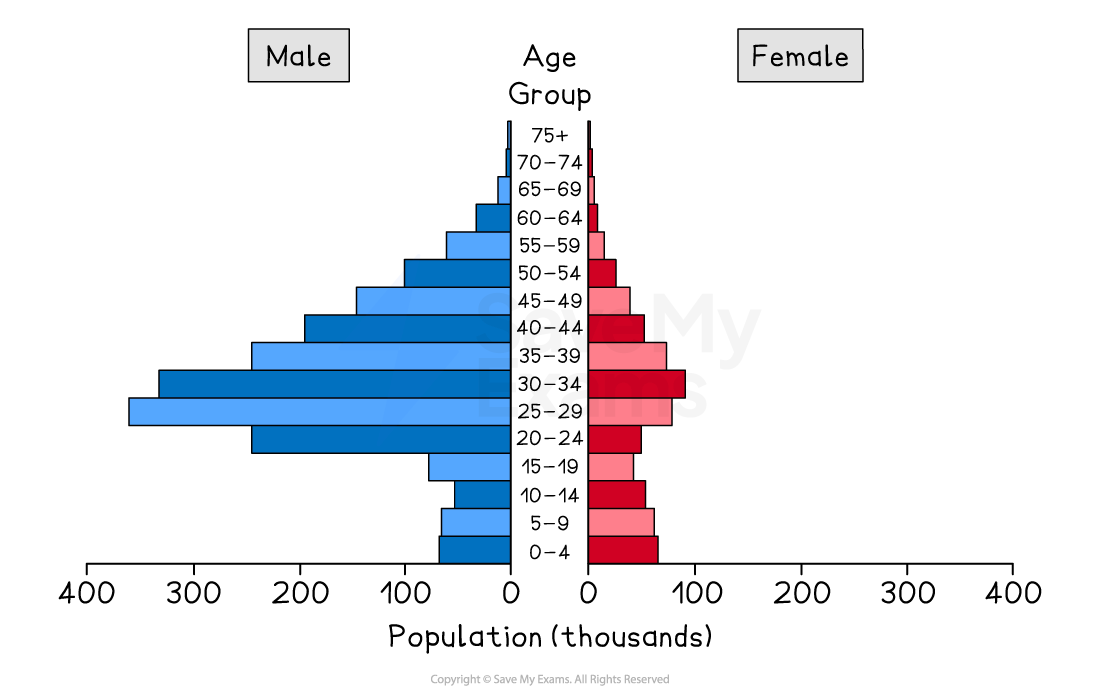
Population structure showing the impact of male dominated migration
-
Rapid population growth in some areas as a result of migration can lead to:
- increased pressure on services such as healthcare and schools
- a shortage of housing
- increased traffic congestion
- increased water and air pollution
- a shortage of food
- a lack of clean water
Was this revision note helpful?
Build on this topic