Diagrams (Cambridge International IGCSE Geography)
Flow diagrams
Spec point — "Candidates should be able to: • select, present, construct and communicate data through appropriate graphs, charts and diagrams using relevant scales and annotations to present information • extract, interpret, analyse and evaluate information presented on graphs, charts and diagrams • identify and evaluate variations, trends and patterns from data provided."
Flow Diagrams
-
Flow diagrams are used to show the movements or flows of people, goods, or materials
-
Desire lines are used to show the general direction of movement on a base map using lines
-
More detailed information is shown in flow line diagrams
- The lines can be used to show quantity (by the thickness of the line)
Pictograms
Spec point — "Candidates should be able to: • select, present, construct and communicate data through appropriate graphs, charts and diagrams using relevant scales and annotations to present information • extract, interpret, analyse and evaluate information presented on graphs, charts and diagrams • identify and evaluate variations, trends and patterns from data provided."
Pictograms
- Pictograms are a way of displaying data using symbols or diagrams drawn to scale
- Useful way of showing data if accuracy is not too important and data is discrete
- Years do not need to be continuous
- Symbols do not need to be whole but can represent a proportion
- A key is needed to show if the total number of objects or events that image represents exceeds one
How to read a pictogram
- Step 1: Read the problem carefully and identify the specific information requested from the pictogram
- Step 2: Count the symbols corresponding to the desired information and report the count
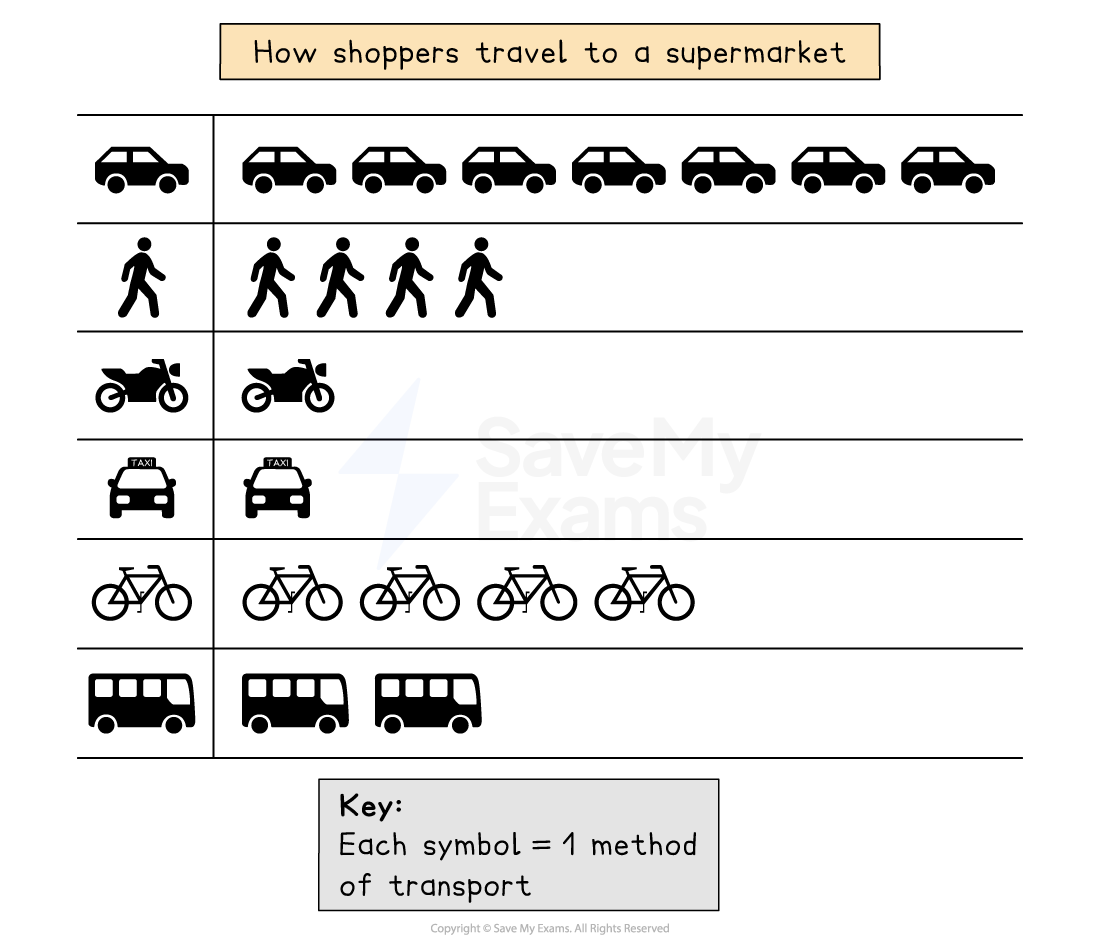
Example of a pictogram
Venn Diagrams
Spec point — "Candidates should be able to: • select, present, construct and communicate data through appropriate graphs, charts and diagrams using relevant scales and annotations to present information • extract, interpret, analyse and evaluate information presented on graphs, charts and diagrams • identify and evaluate variations, trends and patterns from data provided."
Venn Diagrams
-
Venn diagrams can be used to visualise and compare information
-
A Venn diagram is an illustration which uses overlapping circles
-
They can be used to:
- Illustrate similarities and differences for example between urban and rural areas
- Show relationships between sets of data
| Strengths | - A clear visual representation of relationships between sets of information - Allow easy comparison between sets of data |
|---|---|
| Limitations | - Can be confusing if more than two or three sets of data is shown - Can oversimplify geographic processes or information |
Proportional Symbols
Spec point — "Candidates should be able to: • select, present, construct and communicate data through appropriate graphs, charts and diagrams using relevant scales and annotations to present information • extract, interpret, analyse and evaluate information presented on graphs, charts and diagrams • identify and evaluate variations, trends and patterns from data provided."
Proportional Symbols
- The symbols on the map are drawn in proportion to the variable represented
- Usually, a circle or square is used but it could be an image
- Can be used to show a range of data, for example, population, wind farms and electricity they generate, traffic or pedestrian flows
| Strengths | - Illustrates the differences between many places - Easy to read - Data is specific to particular locations |
|---|---|
| Limitations | - Not easy to calculate the actual value - Time-consuming to construct - Positioning on a map may be difficult, particularly with larger symbols |
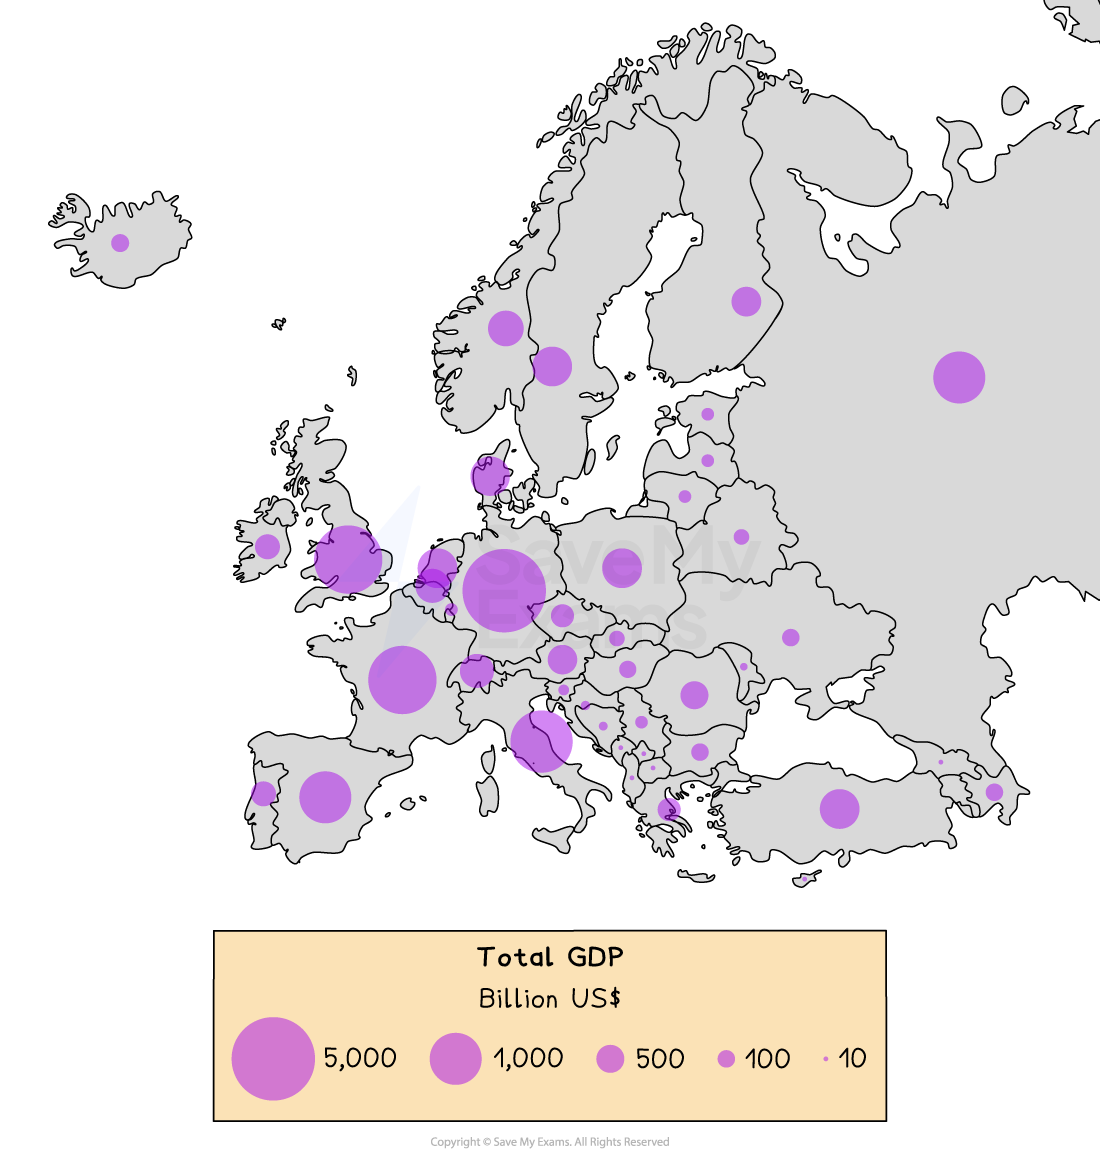
Example of a proportional symbol map
Was this revision note helpful?