Weather Data Interpretation (Cambridge International IGCSE Geography)
Interpreting Weather & Climate Data
Spec point —
2.4.3· Use & interpret graphs & other diagrans showing weather & climate data
Climate graphs
- A climate graph shows mean monthly temperatures and precipitation rates over 30 years
- They can be local, national, or global
- Precipitation is always shown as a bar graph and temperature as a line graph
How to read a climate graph
-
Describe the overall shape of the graph:
- Is the temperature line steep or gentle?
- Are there changes throughout the year?
- Always mention the months but do not give a month-by-month account
-
Look for extremes:
- Note anomalies—something that isn't following a trend
- Summer has the hottest months and winter the coolest (Spring and Autumn are not usually discussed)
- Note the highest and lowest temperature and rainfall, plus the month in which they occur
- Remember to quote units, like Celsius or millimetres
-
Name the season with the most and least rainfall
-
Equatorial climate regions have no seasons but refer to seasons in other locations
-
Remember that the southern hemisphere's seasons are opposite to the northern hemisphere
- Summer in Australia is from November to March
- Summer in Europe is from June to September
-
-
Calculate the temperature range by subtracting the lowest number from the highest
-
Add monthly rainfall totals to calculate annual rainfall
- Divide this by 12 to find the average monthly rainfall
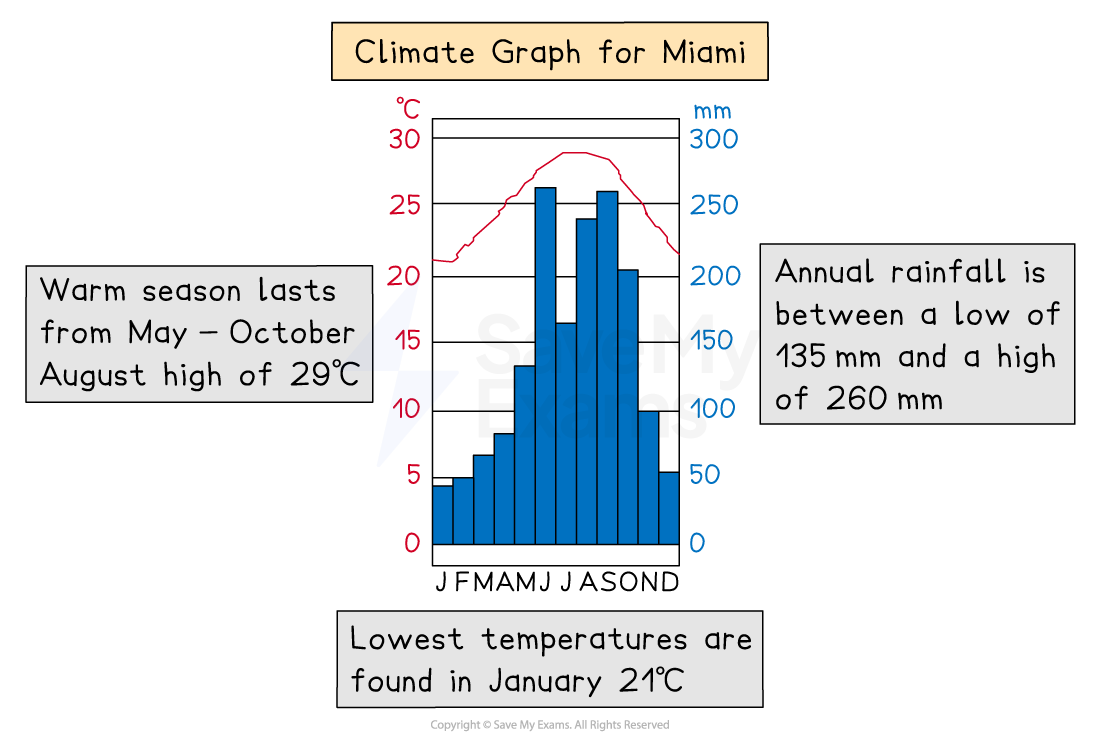
Climate graph
Dispersion graphs
- Useful for comparing sets of data
- Also illustrates whether the data forms groups or is dispersed (spread)
- Values are shown on the vertical axis
- Can also be used to present the upper and lower values along with the mean, median, mode and extreme values
Reading a dispersion graph
- Read the title to see what the graph is showing
- Read and understand what each axis represents
- Describe the overall pattern of the graph
- Identify anomalies in the data
- Complete any statistical analysis such as the mean, median and range
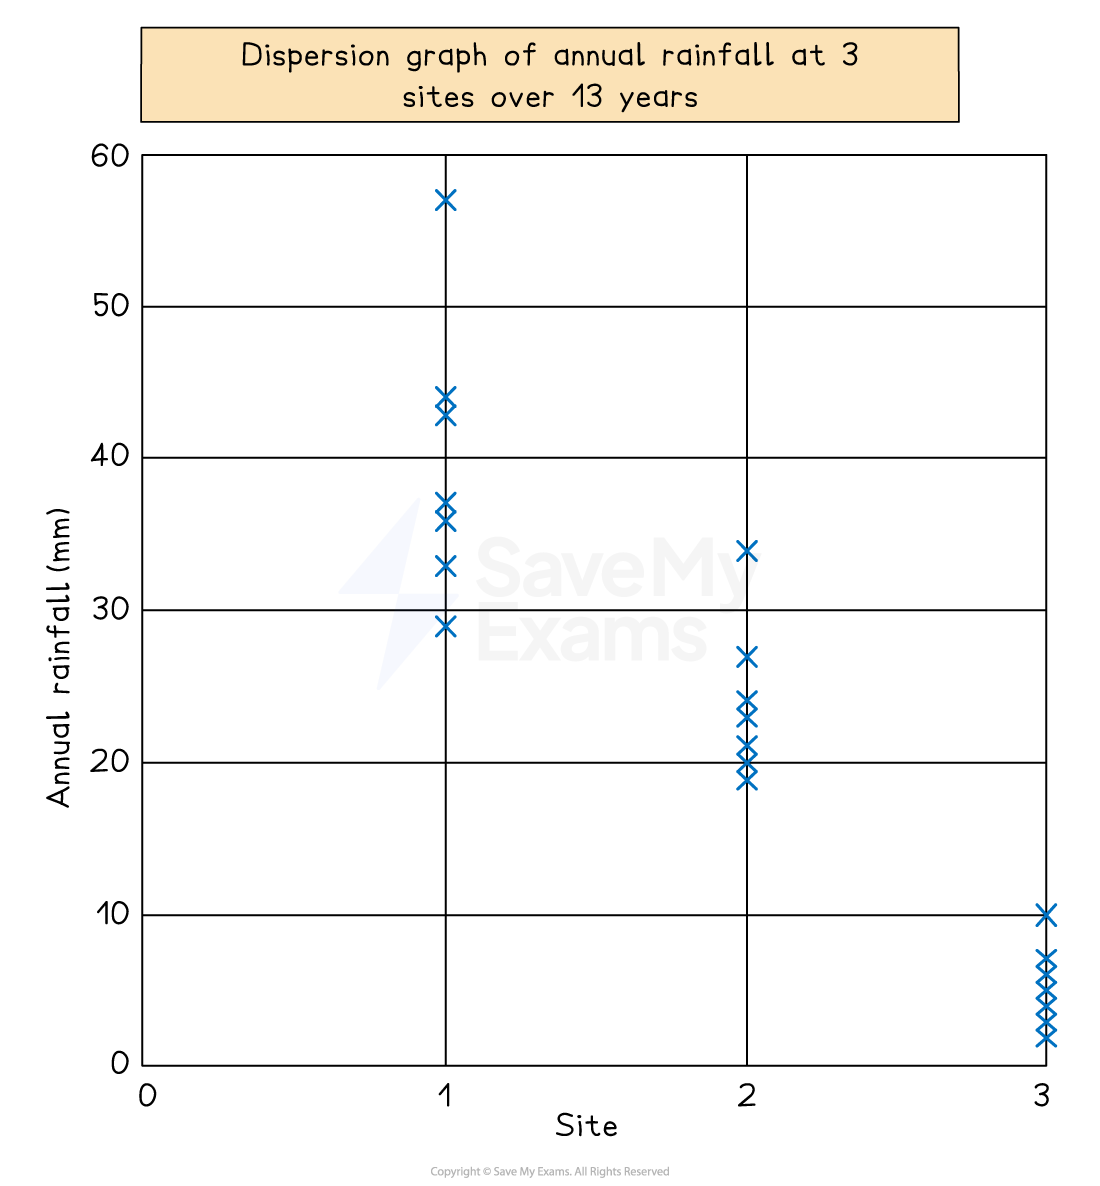
Illustration of dispersal graph
Wind rose
- The direction of wind for a specific place is shown on a wind rose
- Made of circles that radiate rectangles representing points of a compass
- The rectangles' lengths show how many days or times the wind blew in that direction
- The centre of the rose displays the number of days or hours with no wind
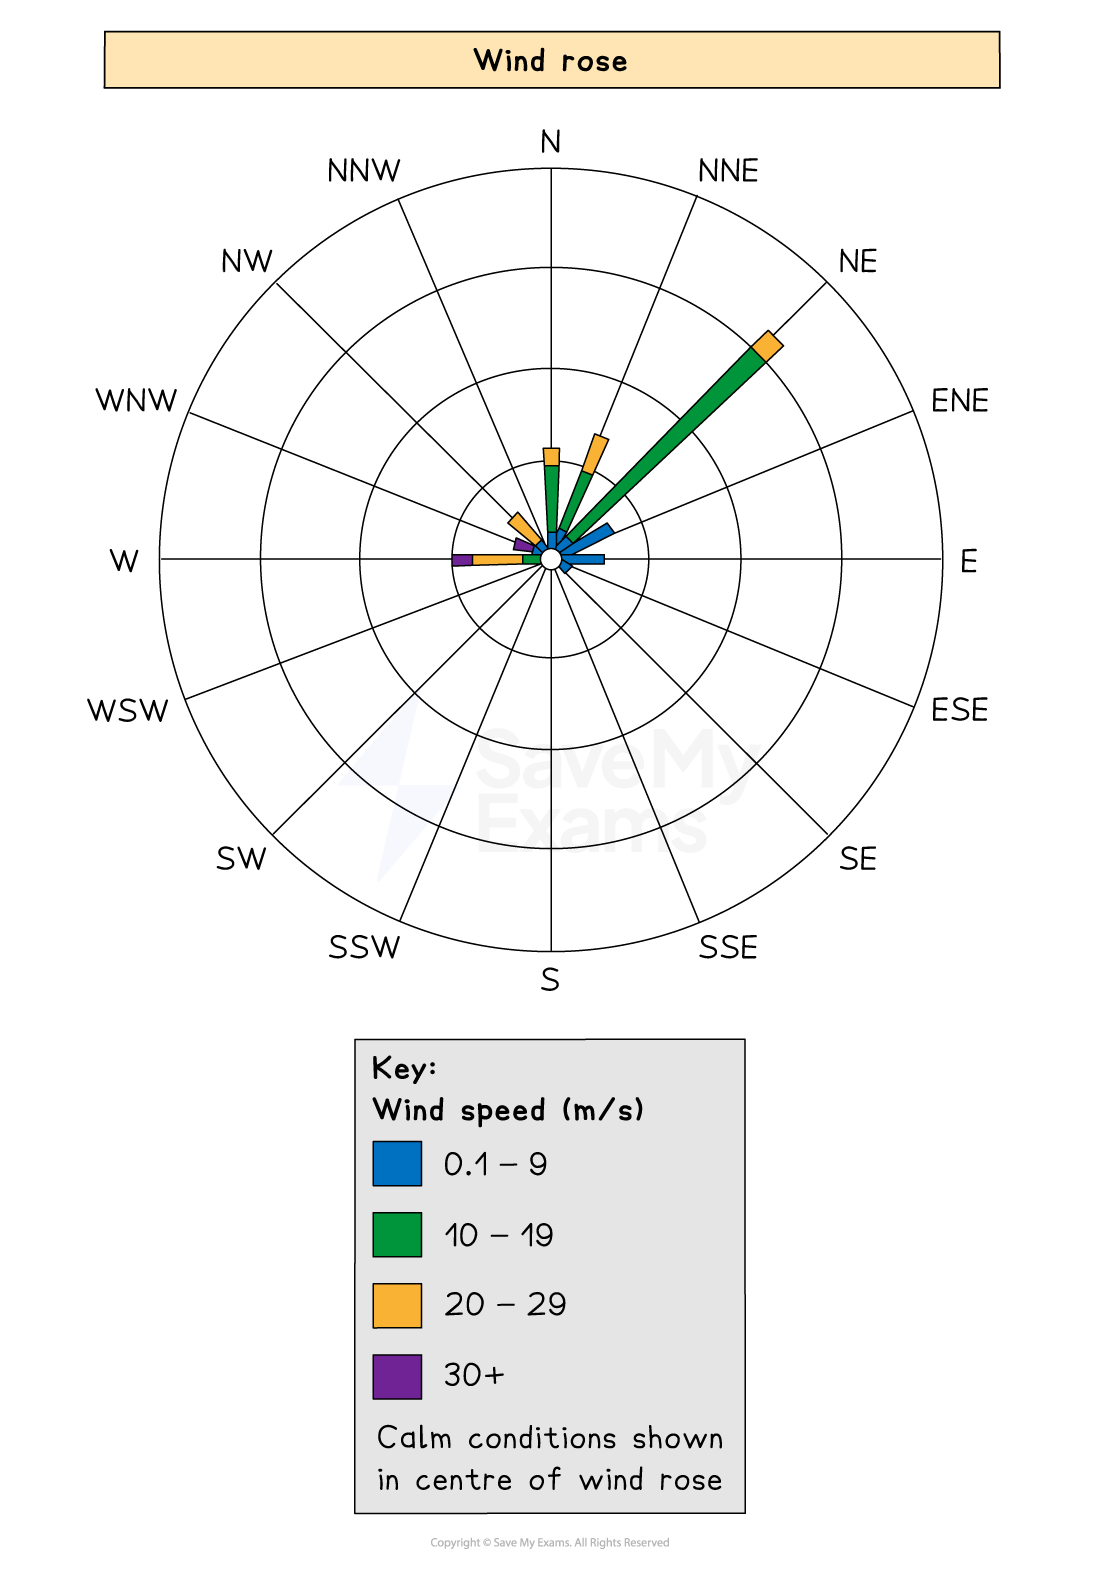
Wind rose diagram
Wind barbs
-
Wind barbs on a weather map indicate the direction and strength of the wind.
-
Barbs point to the direction the wind is travelling from
-
The tip of the arrow shows the wind's direction
-
Half barbs represent 5 knots, full barbs = 10 knots and flags = 50 knots
-
A combination of these symbols shows the overall speed of the wind and from where it originates from
- A double flag = 100 knots
- A double flag and 3 full barbs with a half barb = 135 knots
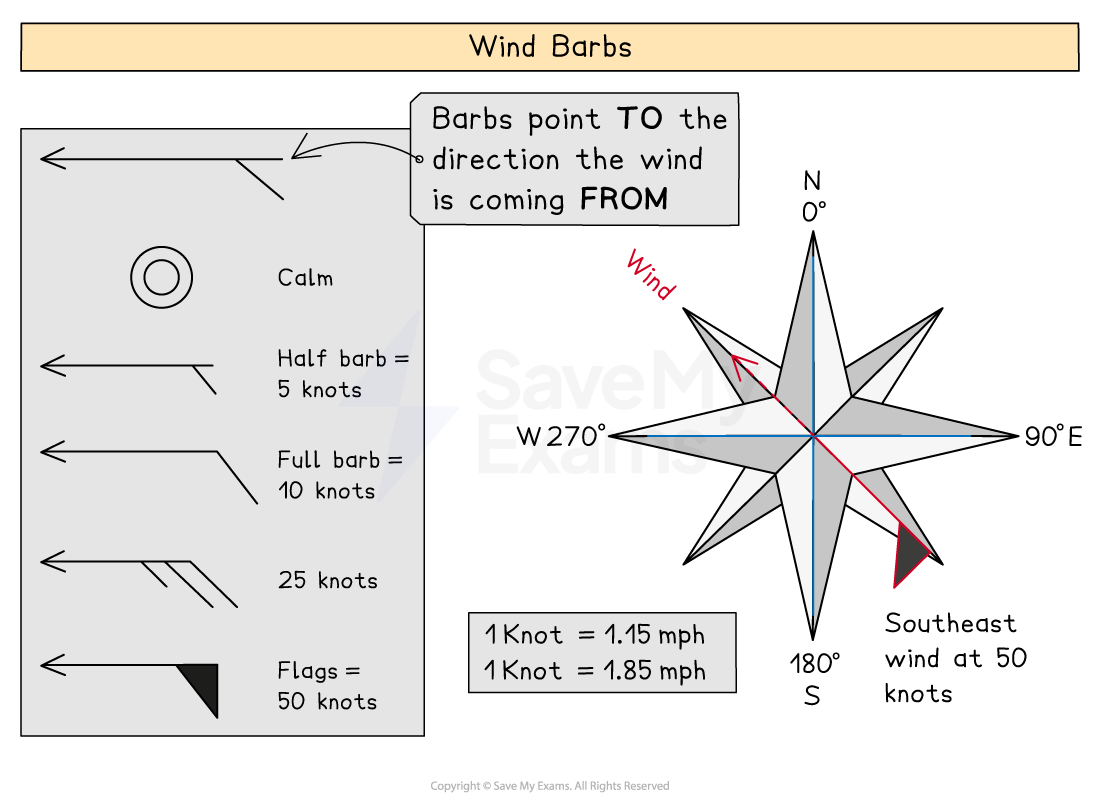
Illustration to show wind barbs
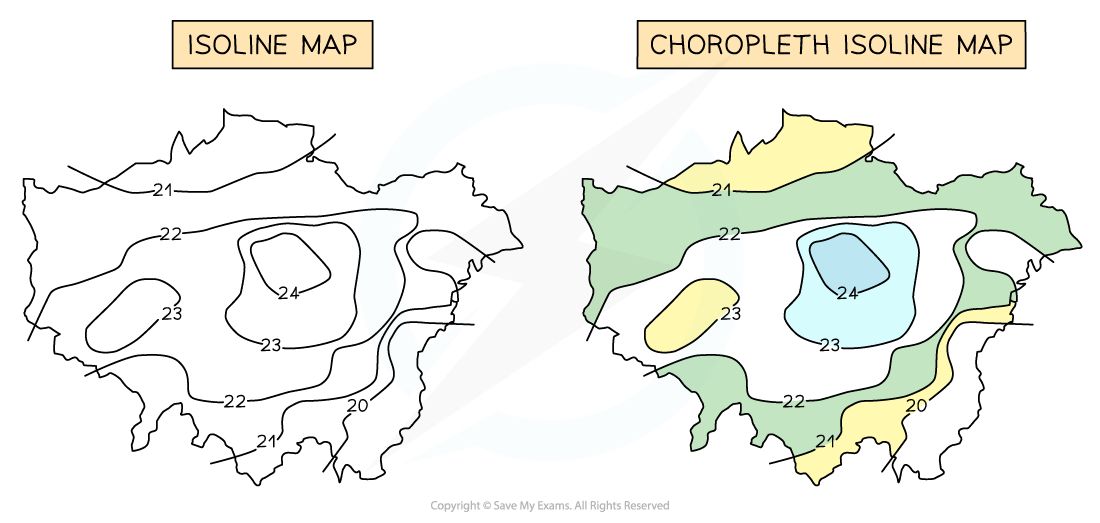
Isoline and choropleth maps
-
Isohyets are lines joining places with the same amount of rainfall
-
Isotherms join places with the same temperature
-
Isobars join places with the same pressure
-
Isoline maps become choropleth isoline maps when shaded between the isolines
- Shading is progressive from light to dark
- The heaviest (darkest) shading is for the largest value
Synoptic charts
-
Meteorological station readings are plotted on synoptic charts
-
They can show some or all of the following:
- wind speed
- wind direction
- pressure patterns
- weather fronts
- cloud cover
- temperatures
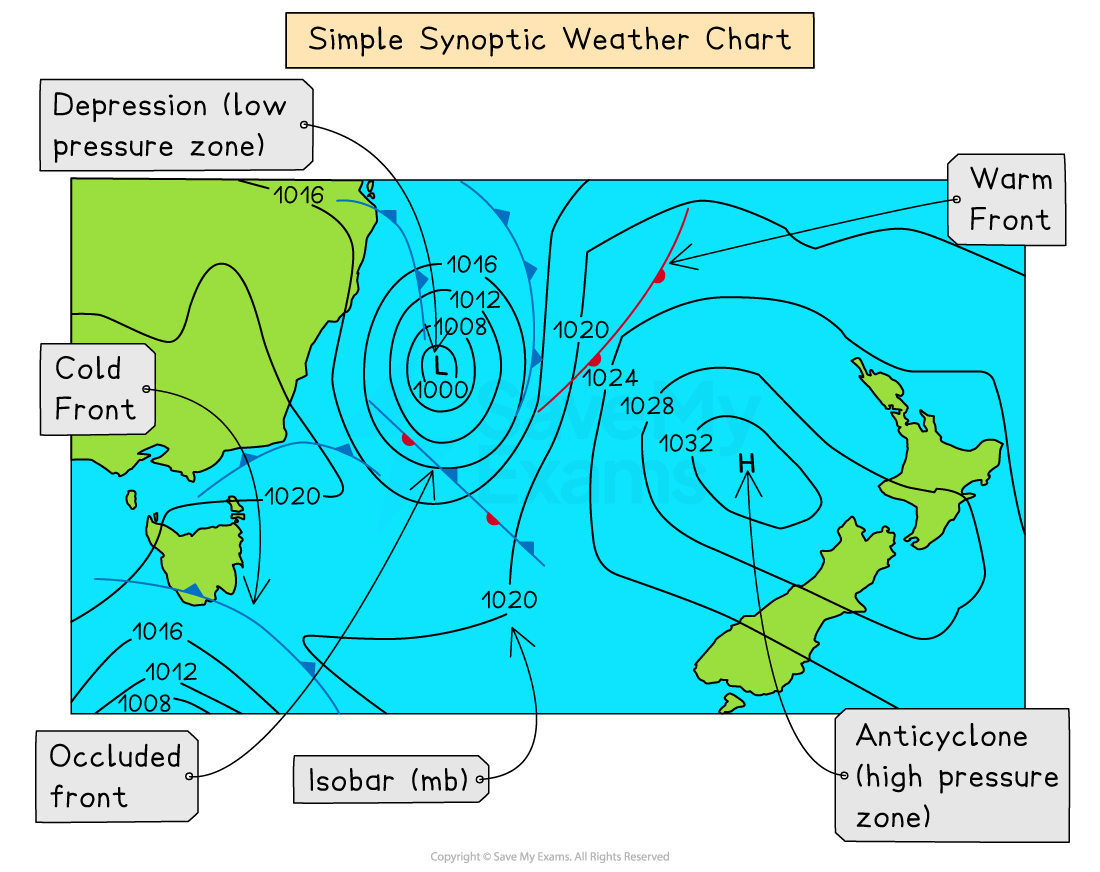
Synoptic weather chart
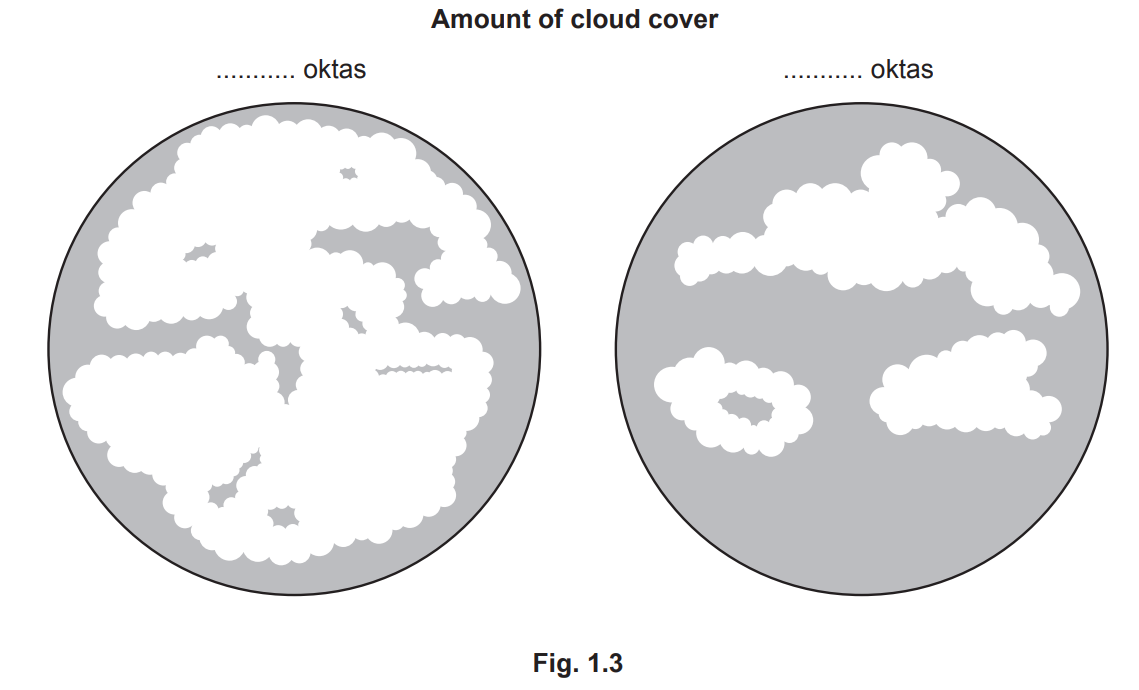
Worked Example Fig. 1.3 shows a student's record of cloud cover over two days. The student recorded the amounts in oktas (eighths).
Diagram showing cloud cover
Choose from the values below and fill in the correct number of oktas for each example.
[2 marks]
Choose from the following:
- 1 okta
- 3 oktas
- 7 oktas
- 8 oktas
Solution
**The correct answer for example 1 is 7 oktas [1 mark]
The correct answer for example** 2 is 3 oktas [1 mark]
Was this revision note helpful?
Build on this topic