Maps (Cambridge International IGCSE Geography)
Spec point — Use a co-ordinate reference system and to give and read four-figure and six-figure grid references to locate places. Give directions, both in terms of a 16-point compass (such as north, north-north east, north east, etc.) and as a bearing from grid north of one place from another. Be able to measure horizontal distances, calculate height, complete a cross-section, interpret physical and human landscapes and features.
Maps
-
Questions in the exam will be based on topographical maps
- The maps can be from anywhere in the world
- Maps will have a key, scale, northings and eastings
- These all need to be used to answer the questions
Grid references
-
4-figure are used to locate specific grid squares within the map
- The first two figures are the eastings, which indicate how far east or west a grid is across the map
- The second two figures are the northings, which indicate how far north or south a grid is on the map
-
6-figure grid references are used to locate exact points within grid squares
- The first three figures are the eastings
- The second three figures are the northings
-
To find a 4 and 6 figure grid reference
- First, find the four-figure grid reference by giving the number from the bottom of the map first and then the number from the side of the map.
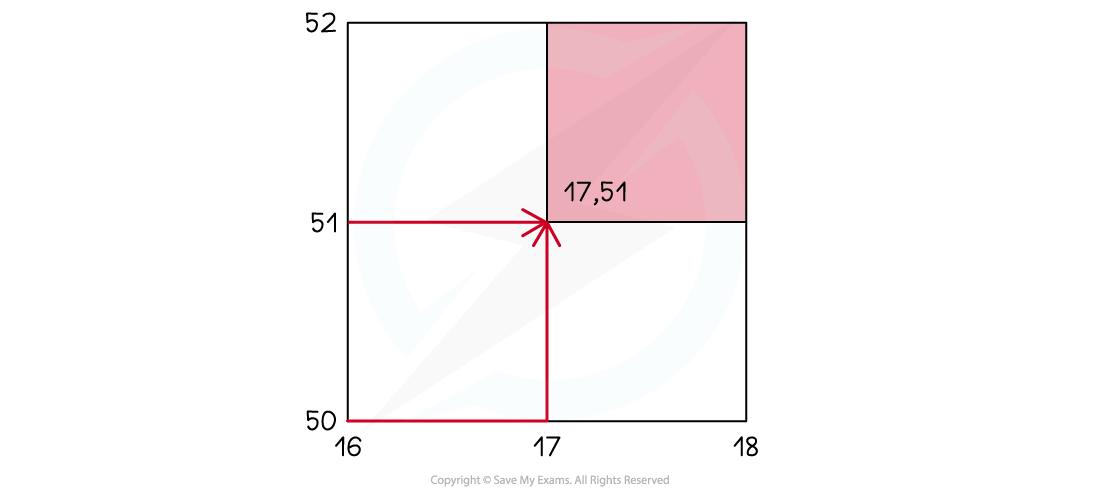
4 - figure grid reference
- In image above, the 4-figure grid reference would be 17, 51
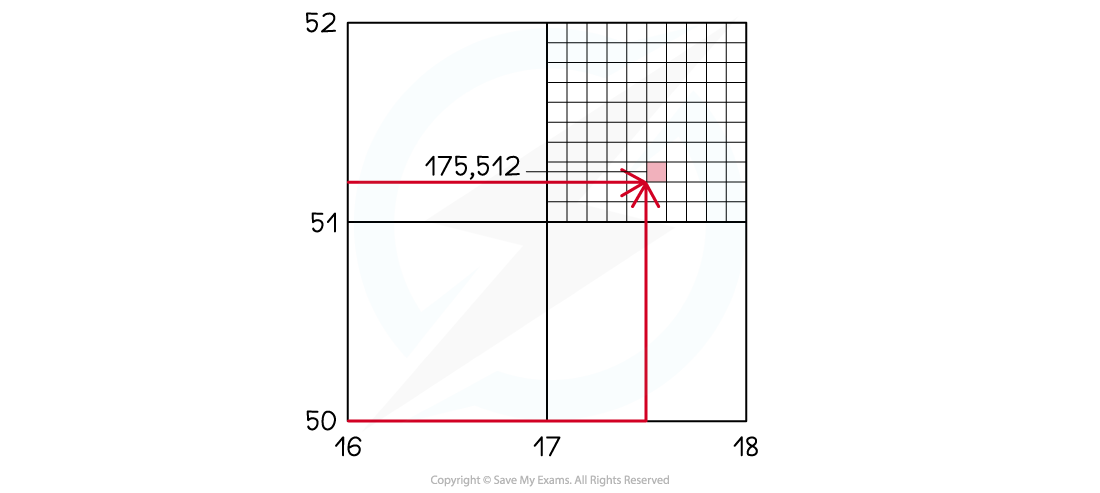
- To give the 6-figure grid reference, you need to imagine that the grid square is divided into 100 smaller squares
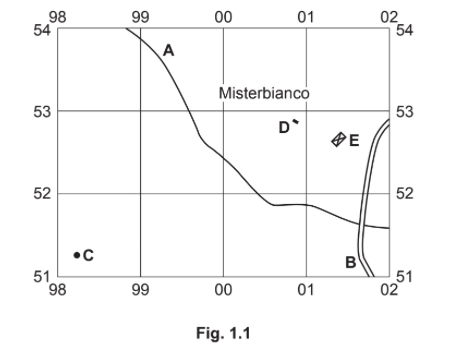
Worked Example Figure 1.1 shows some of the features around the main settlement at Misterblanco in the north-east of the map extract
What is the six-figure grid reference of the junction to the north of B in Fig 1.1?
[1 mark]
Final answer: Answer
- 017 517
Exam Hint The paper 2 exam will always contain a map. You will be expected to be able to give and use grid references to locate specific places on the map extract.
Scale
-
Maps in exams will be scaled at either:
- 1:25,000 (1 cm = 250 m in real life)
- 1:50,000 (1 cm = 500 m in real life)
-
Distance measurement methods:
-
For straight or nearly straight distances:
- Use a ruler
- Use the edge of a straight piece of paper
-
Using map scale:
- Mark distances on a piece of paper using the scale at the map's bottom
- Lay the marked paper from first to second point to calculate distance
-
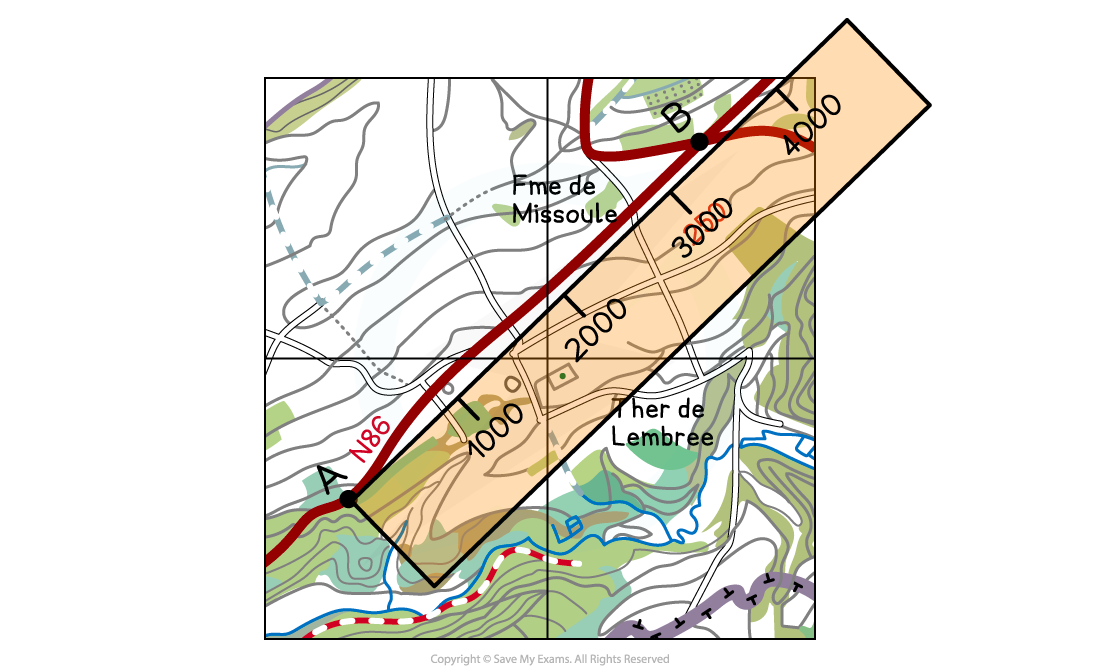
Using scale to measure a straight line
-
Measuring curved route distances:
- Divide the route into segments
- Rotate and mark the paper in stages to calculate the full distance
-
Measuring road route on map:
- Divide the route into straight sections using crosses
- Use the paper to measure from A to the first cross
- Rotate the paper, pivoting at the cross to mark the second cross
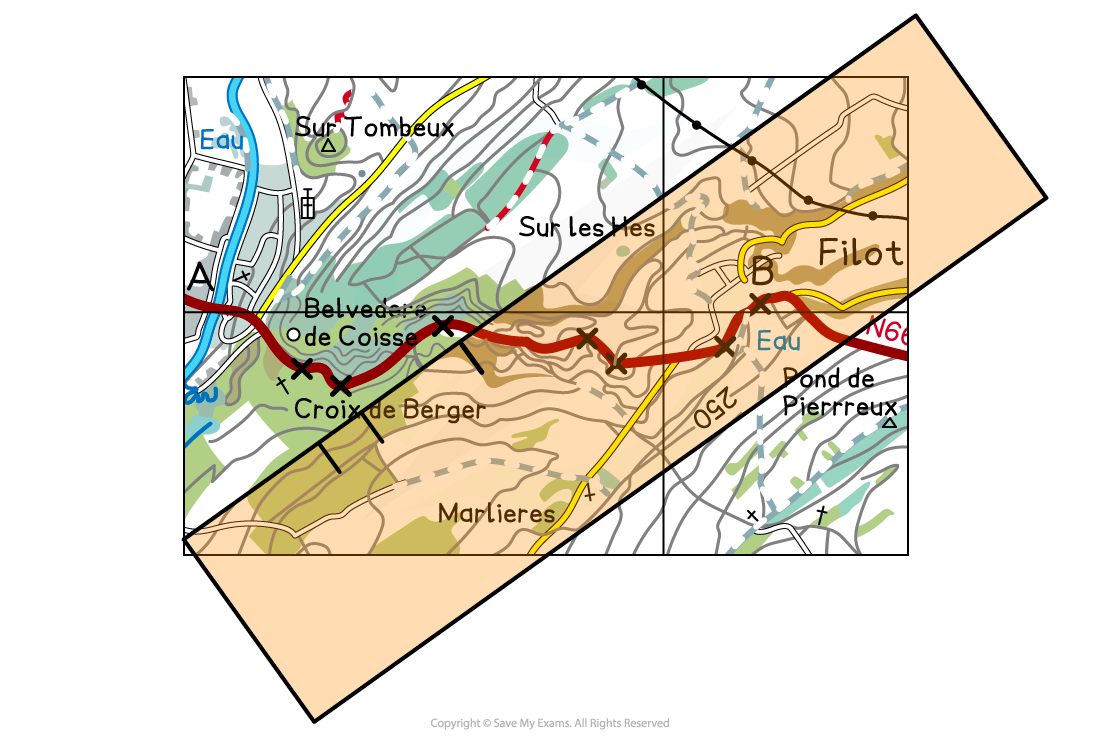
Measuring a curved route
Bearings
- Directions on a map should always be given using compass points
- There are 16 compass points
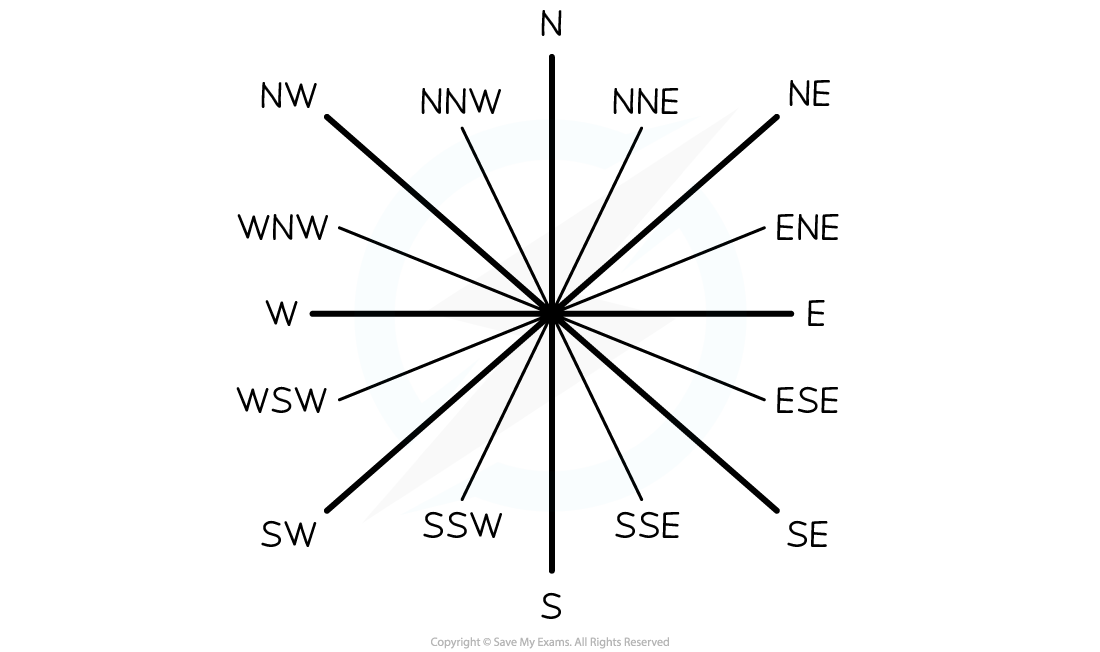
Sixteen Compass Points
-
A grid bearing is measured from the grid north at 0°, east at 90°, south at 180°, and west at 270°
-
Grid bearings are given using a protractor
- The 0º should be pointing north and the centre of the protractor on the place the bearing is been given from
- The compass direction and grid bearing from the crossroads at A to the location at B
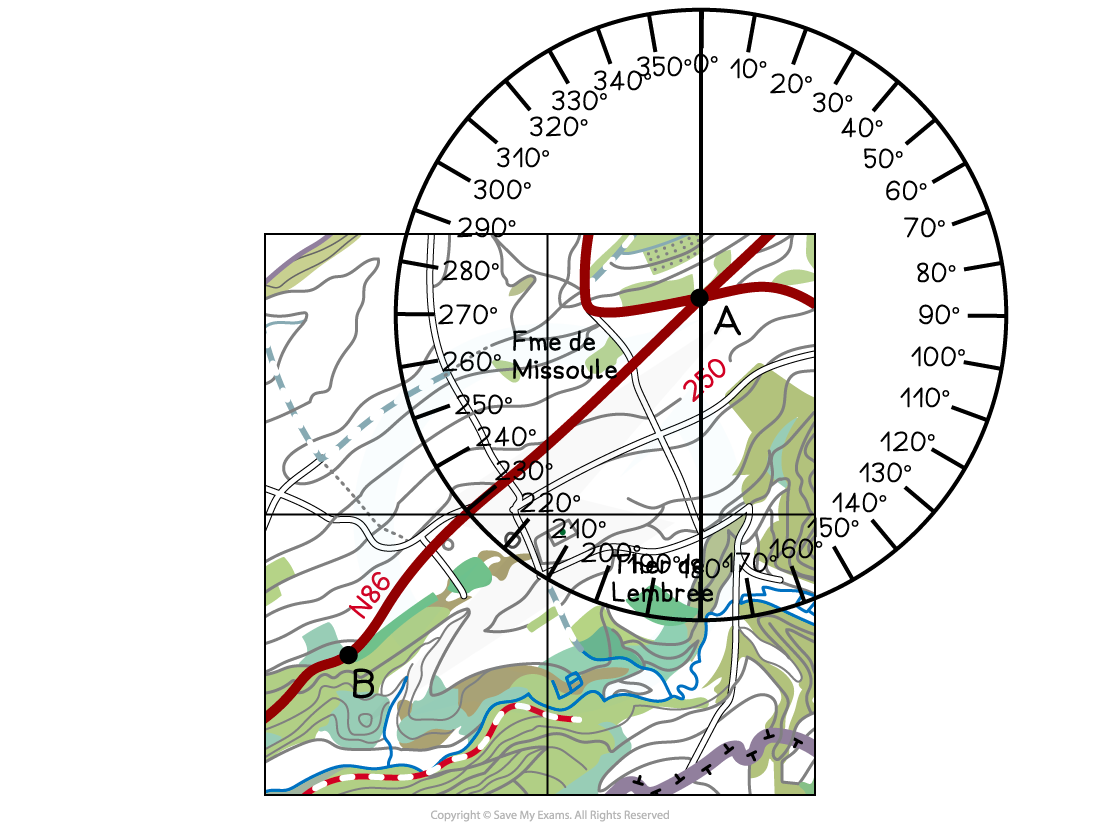
Illustration showing how to take a map bearing
- On the map below, B is south-west of A
- The bearing is 230º
Height
-
Height can be shown in three main ways:
- spot height
- contour lines
- trigonometrical (trig) stations
-
Spot heights show the height at a specific point with the height measurement written next to it
-
Contour lines are isolines
- They join points of equal height and are usually at 5 or 10-metre intervals (distance between the contour line) this means that the height of the land increases by 5 or 10 metres between the lines
-
A trigonometrical (trig) station is marked by a small black triangle with a height measurement written next to it
Topography
- The contour lines can also indicate the shape and slope of the land or topography
- Contour lines close together indicate steep land
- Contour lines very far apart indicate gently sloping or flat land dependent on the distance apart
- V-shaped valleys have a v-shaped set of contours
- A hill is shown by a set of circular contour lines
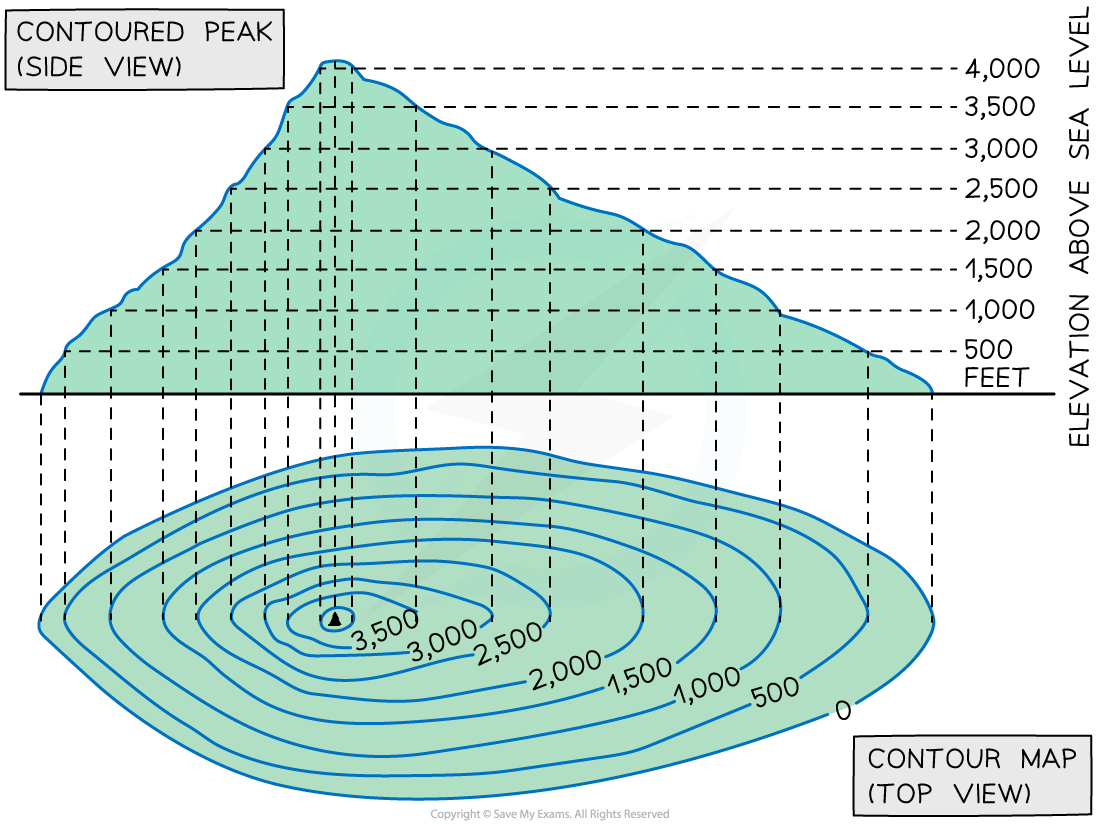
*Contour lines *
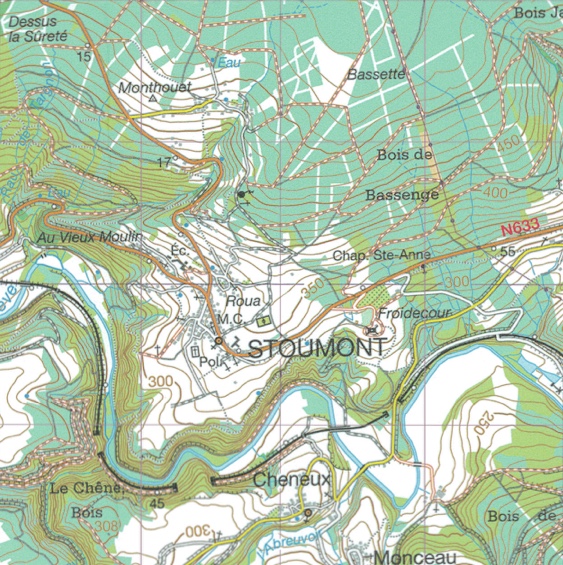
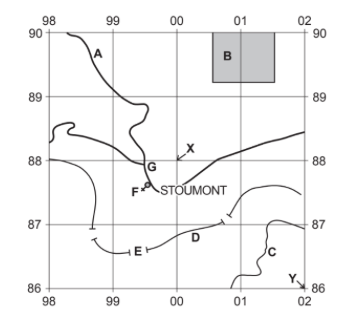
Worked Example Study the map extract and Fig 1 for Stoumont, Belgium. The scale is 1:50000
Fig 1
Using the map extract, identify the following features shown in Fig. 1
The height above sea level of the contour at C
.................... metres
[1 mark]
Final answer: Answer
- 250 metres
Cross-sections
- A cross-section is a slice through the landscape
- They are represented on a map by a line, which is often labelled A at one end and B at the other
- They use the contour lines to determine the height of the land
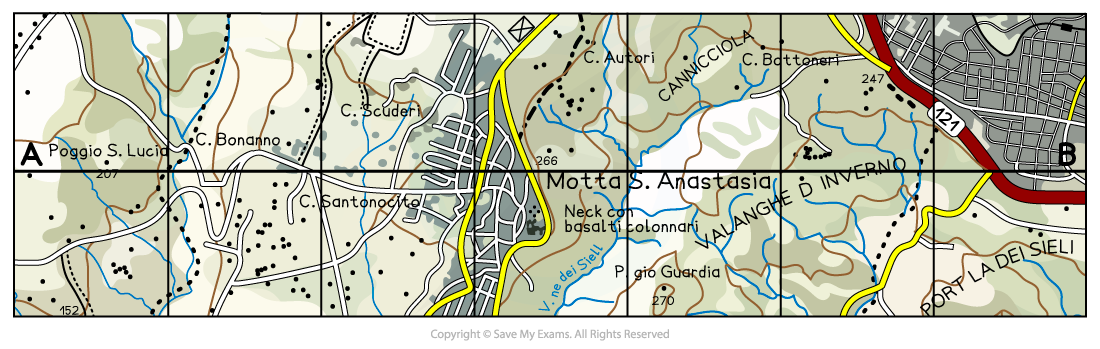
Cross-section on a map
- A piece of paper is then laid along the line and points A and B are marked on
- The contour lines are then marked on each time they cross the paper
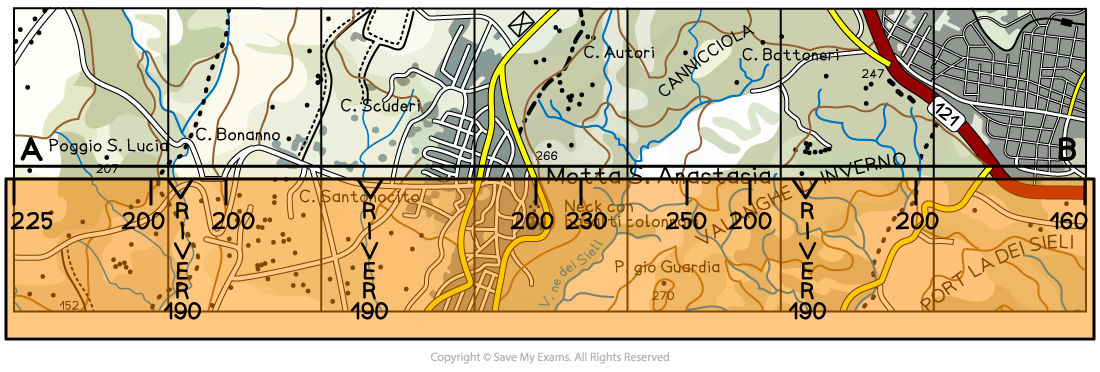
Marking on the contour lines
- These figures can then be used to create the cross-section
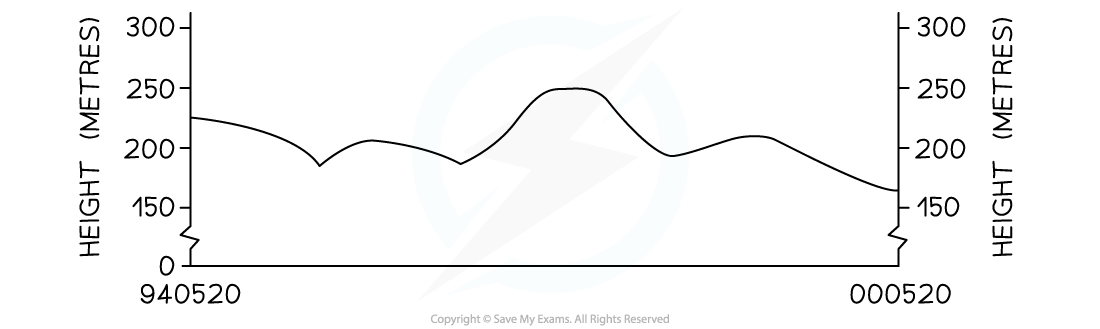
Exam Hint In the exam, you may be asked to finish a cross-section or interpret a cross-section. When interpreting cross-sections, you should include:
- The highest and lowest points
- Comparison of slopes
- Anamolies
Key
- Maps can be used to identify a range of landscape features
- These may be physical and human features
- Each map has a key to show what the symbols mean
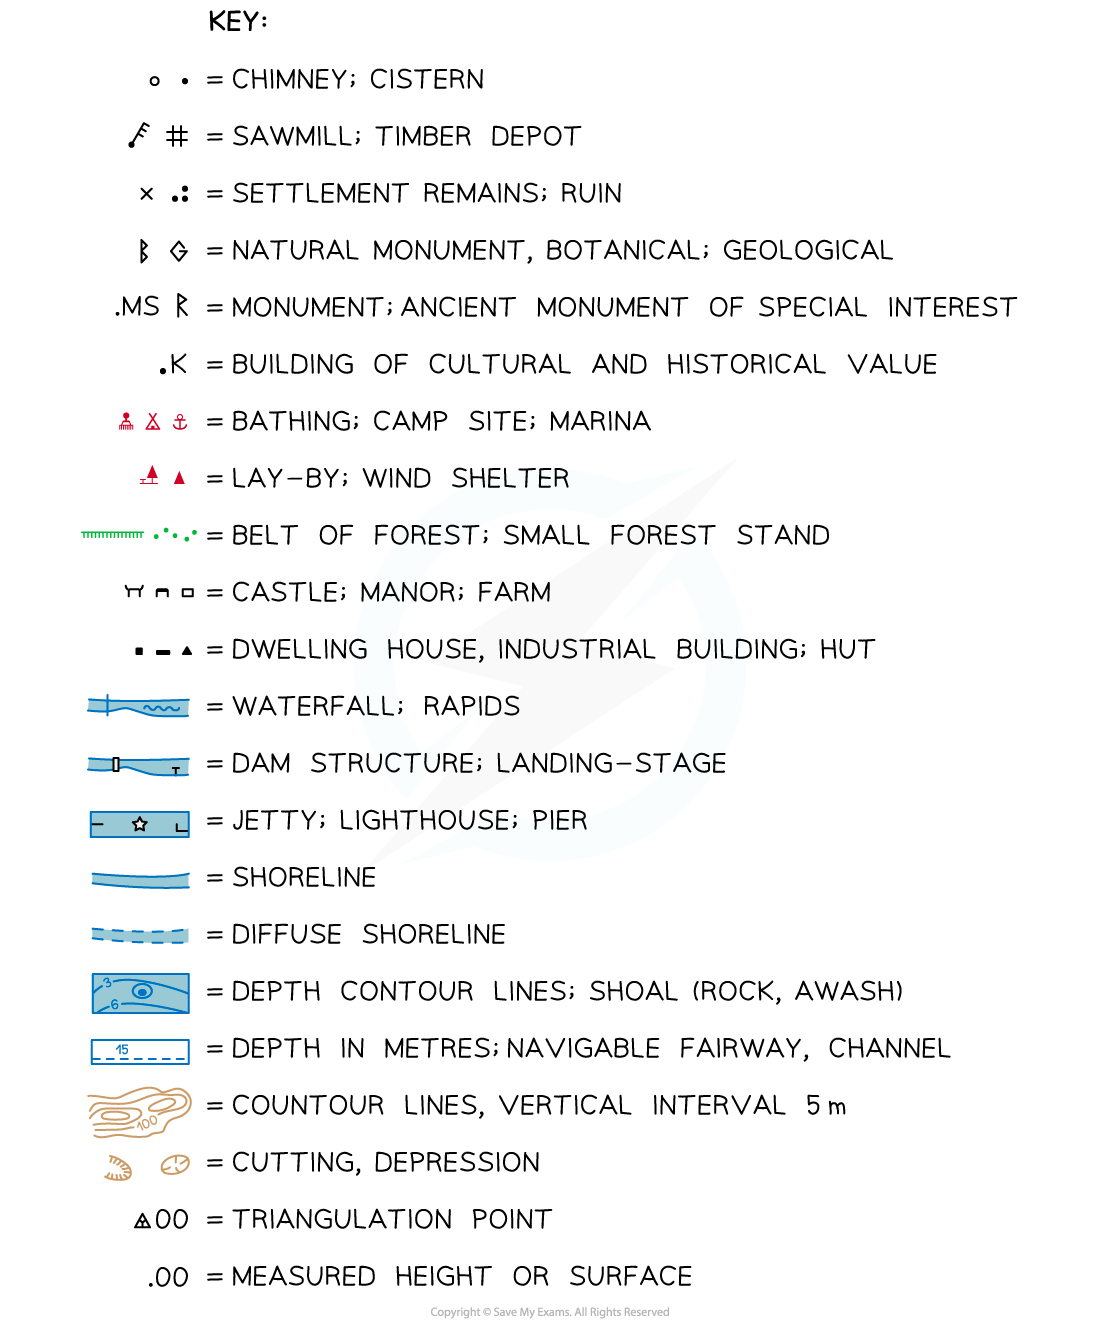
Example of a map key
Was this revision note helpful?
Build on this topic