Venn Diagrams (Cambridge International AS Mathematics)
Venn Diagrams
What is a Venn diagram?
-
A Venn diagram is a way to illustrate events and are particularly useful when outcomes overlap
-
Venn diagrams are mostly used for 2 or 3 events
-
A Venn diagram consists of a box (rectangle) and a bubble (circle/ellipse) for each event
- Bubbles may or may not overlap
- Bubble(s) is not a technical term, but we like it!
-
The box represents all outcomes
- It is often referred to as the Universal Set and is commonly labelled with the symbols (Kunstler script font uppercase letter E) (Greek lowercase letter Xi)
- There is no standardised symbol for this purpose
-
Bubbles are labelled with their event name (A, B, etc)
-
The numbers inside a Venn diagram (there should be one in each region) will represent either a frequency or a probability
- In the case of probabilities being shown, all values should total 1
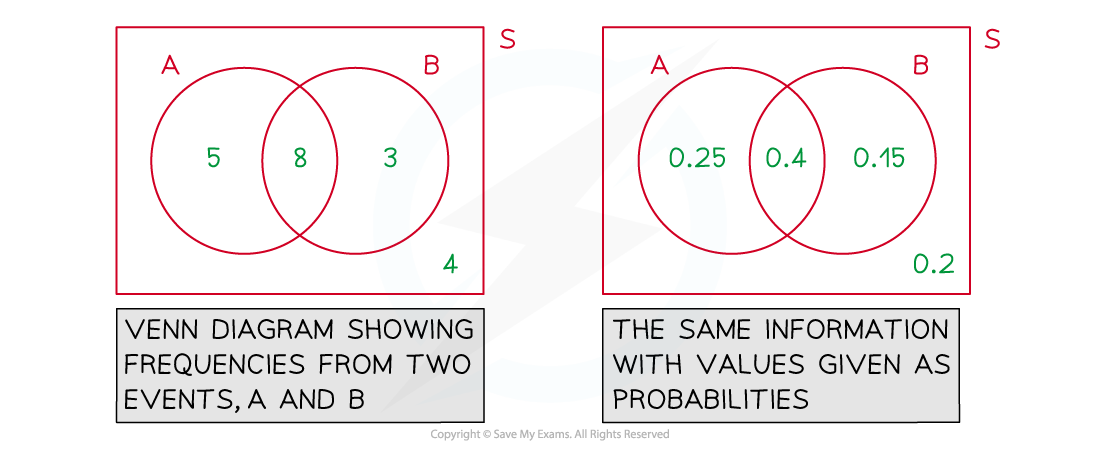
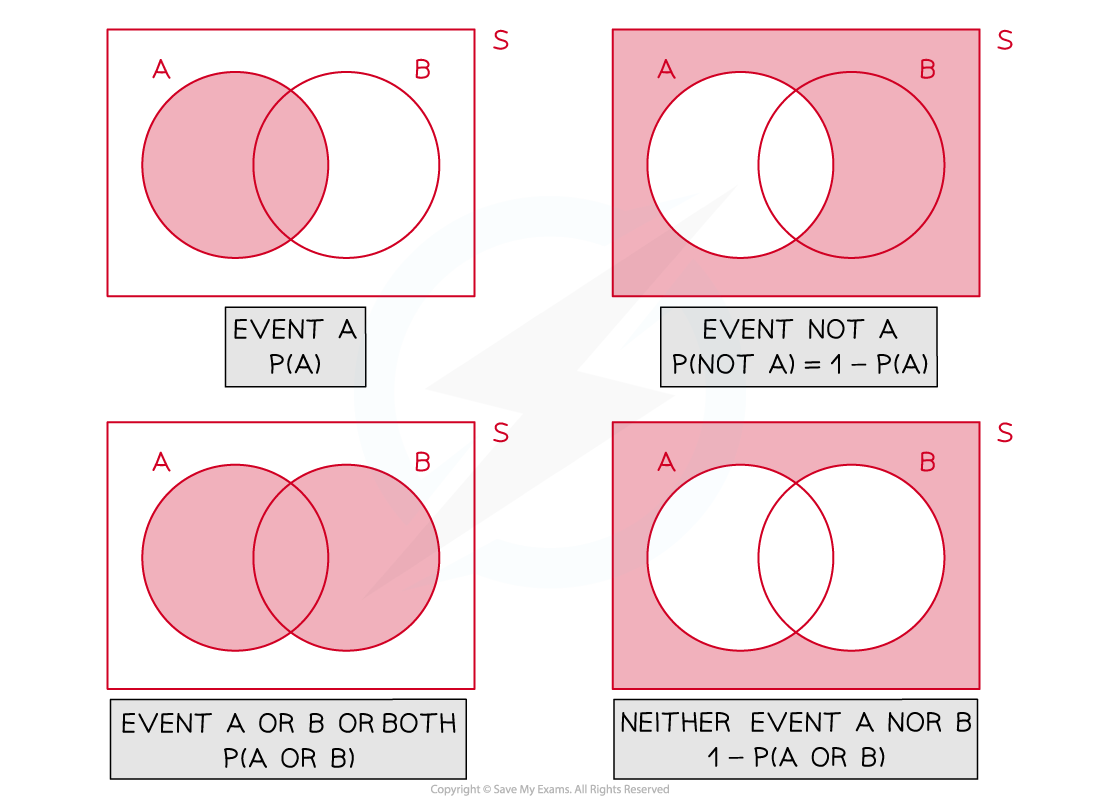
What do the different regions and bubbles overlapping mean on a Venn diagram?
- This will depend on how many events there are and how the outcomes overlap
- Venn diagrams show ‘AND’ and ‘OR’ statements easily
Worked Example 40 people were surveyed regarding which games consoles they owned.
8 people said they owned a Playstation 5 () and an Xbox Series X ().
5 people said they owned neither of these consoles.
Of those people that owned only one games console, twice as many owned an Xbox Series X as a Playstation 5.
One of the 40 people is chosen at random. Find the probability that this person
(i) owns both consoles,
(ii) owns exactly one console,
(iii) doesn’t own a Playstation 5.
Answer:
Exam Hint
The rectangle in a Venn diagram is a key part of the diagram
- it represents all possible outcomes of the experiment
- the bubbles merely represent the events we are particularly interested in
- there is usually a few possibilities that fall outside of these events so this would be the section outside the bubbles but inside the rectangle
A quick ‘mini-Venn’ diagram shading the parts required to answer the question can be useful rather than always drawing a full Venn diagram with all its values
Was this revision note helpful?
Build on this topic