15 marksmedium
A student used a questionnaire to ask some people in Ethiopia for their opinion on how forest cover has changed in their local area.
Table 4.1 shows the results of the questionnaire.
Table 4.1
| percentage response | ||||
|---|---|---|---|---|
| rapidly decreasing | gradually decreasing | same as before | increasing | no opinion |
| 50 | 30 | 10 | 7 | 3 |
(i) Write a suitable conclusion that summarises the main opinion on how forest cover has changed in Ethiopia.
(1 mark)
(ii) Draw a pie chart of the data in Table 4.1. Complete the key
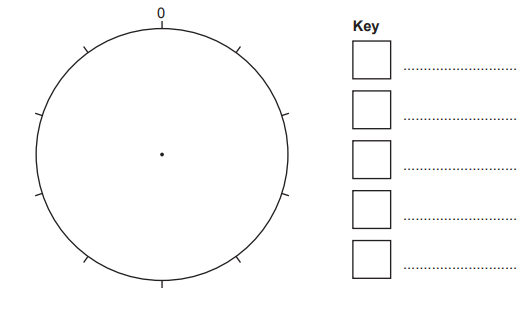
(3 marks)
(iii) Suggest one piece of additional information that is needed to ensure the data in Table 4.1 is reliable.
(1 mark)