Using Break-Even Charts (Cambridge International AS Business)
Features of break-even charts
-
A break-even chart is a visual representation of the breakeven point and is used to identify the following elements
- Fixed costs,total costs and revenue over a range of output
- The break-even point — where total costs are equal to revenue
- Profit or loss made at each level of output
- The margin of safety, which is the difference between the actual level of output and the break-even level of output
An example break-even chart
*The breakeven chart for A2B Limited shows that at 324 units, the total revenue equals the total costs *
-
Fixed costs do not change as output increases
- A2B Limited's fixed costs are £8,000, and these do not change, whether the business produces zero units or 500 units
- Fixed costs are represented by the horizontal red line
-
Total costs are made up of fixed and variable costs
- At zero units of output, they are made up exclusively of fixed costs
- At 500 units, the total variable costs equate to £11,800
- This green line slopes upwards because total variable costs increase as output increases
-
The revenue line also slopes upwards
- At zero units of output, the revenue is £0
- At 500 units, the total revenue equates to £11,800
- Revenue will increase with the output
- This blue line slopes more steeply than total costs and crosses the total costs line at some point
-
The break-even point (BEP) is the point at which the total costs and the revenue lines cross each other
- The breakeven level of output for A2B Limited is 324 units
-
The margin of safety can be identified as the difference on the x-axis between the actual level of output (in this case, 450 units) and the breakeven point (324 units)
-
The level of profit made at a specific level of output can be identified as the space between the revenue and total costs lines
- In this instance, the profit made at 450 units of output is £14,400 - £11,250 = £3,150
Using break-even charts
- Changing any of the variables of breakeven (selling price, variable cost per unit or total fixed costs) changes the breakeven point and level of profit the business can expect to achieve
Changes in variables and the breakeven point
Increased selling price
An increase in the selling price means fewer units need to be sold to break even
- An increase in the selling price increases revenue at each level of output from R1 to R2
- The breakeven point falls from BEP1 to BEP2
- The profit on each unit of output is greater than the amount by which the breakeven point increases
Decreased selling price
- A decrease in the selling price increases the break-even point
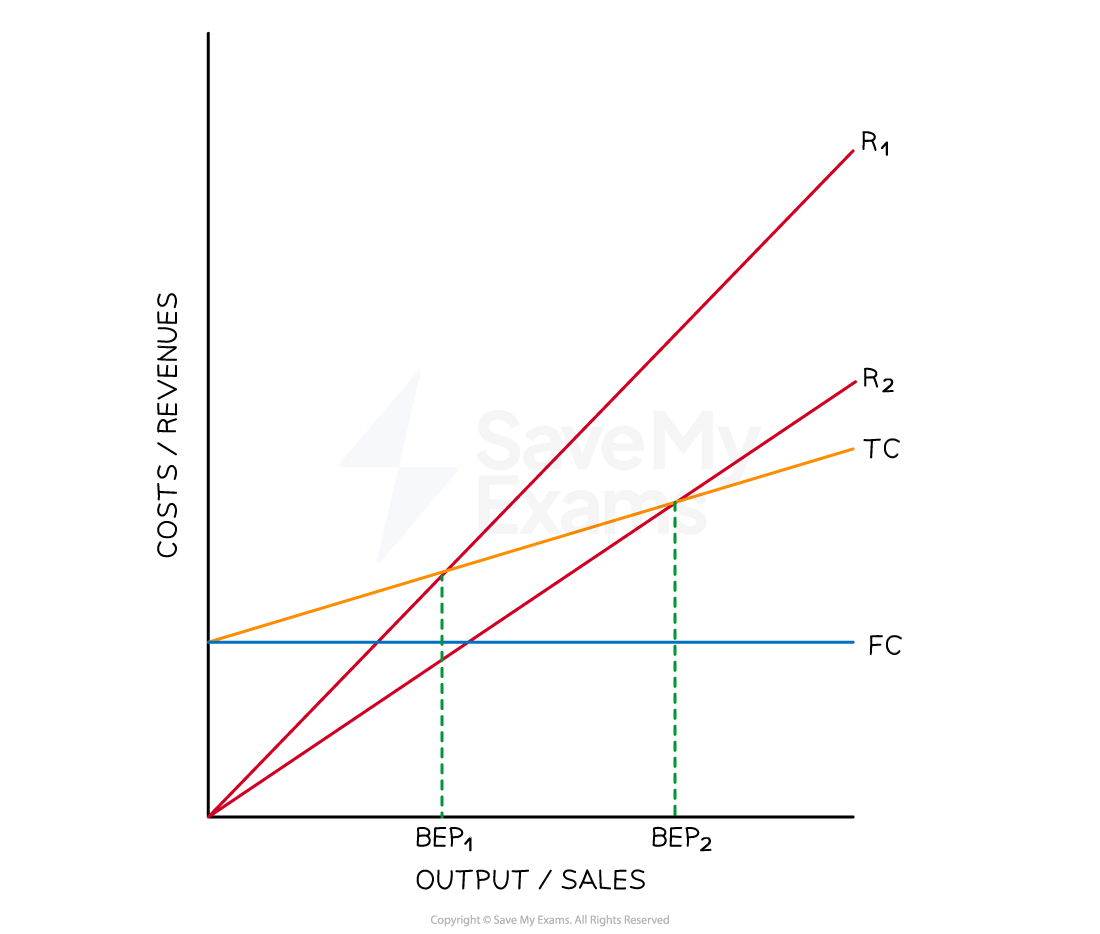
- A decrease in the selling price reduces revenue at each level of output from R1 to R2
- The break-even point rises from BEP1 to BEP2
Increased variable costs
An increase in variable costs increases the breakeven point of a firm
- An increase in variable costs increases total costs at each level of output from TC1 to TC2
- The breakeven point rises from BEP1 to BEP2
- The profit on each unit of output is greater than the amount by which the break-even point reduces
Decreased variable costs
A decrease in variable costs lowers the breakeven point of a firm
- A decrease in variable costs reduces total costs at each level of output from TC1 to TC2
- The breakeven point falls from BEP1 to BEP2
- The profit on each unit of output is greater than the amount by which the break-even point increases
Increased fixed costs
An increase in fixed costs raises the number of units a firm needs to sell to break even
- An increase in fixed costs increases total costs at each level of output from TC1 to TC2
- The breakeven point increases from BEP1 to BEP2
- The profit on each unit of output is greater than the amount by which the break-even point reduces
Decreased fixed costs
A decreased level of fixed costs means that the firm has to sell fewer units to break even
- A decrease in fixed costs reduces total costs at each level of output from TC1 to TC2
- The breakeven point falls from BEP1 to BEP2
- The profit on each unit of output is greater than the amount by which the break-even point reduces
Evaluating break-even charts
- A key advantage of using break-even charts is that they allow managers to model the impact of different pricing strategies before implementing them
- However, assuming that costs are linear straight-line costs or ignoring bulk buying discounts and *overtime *costs in calculations limit their usefulness
Evaluating break-even charts
| Advantages | Disadvantages |
|---|---|
| - They are simple and visual - They are easy to understand - They clearly show the break-even point, costs and potential profit or loss | - Assumes all output is sold - In real life, not every unit produced may be sold |
| - Supports decision-making - They help managers see how changes in cost, price or output affect profit | - Based on estimates - Inaccurate cost or price data can lead to misleading results |
| - Useful for setting targets - They show how many units need to be sold to break even or achieve a profit | - Not suitable for multiple products - They only work well when analysing one product at a time |
| - Allows ‘what if?’ analysis - They are easy to adjust and explore different scenarios, such as rising costs or price cuts | - Ignores external factors - They do not consider competition, demand changes or customer behaviour |
Was this revision note helpful?
Build on this topic